Definition of management dashboards<\/span> is simple – it is a tool for visualisation and interactive analysis
of the most important numbers that are of interest for specific Manager on single screen.<\/h2>\n<\/p>\nHowever, it is merely one of the elements in the whole system of working with data.
\nDashboard<\/strong> is the final visualisation of the processes being performed on the data,
such as exploration, analysis and transformation (conversion) of data<\/strong>.\n<\/p>\nDashboards are built for:<\/p>\n
– Quick and easy access to the most important, automatically updated information – via web and mobile devices<\/span>
\n
\n– Obtaining a quick and unambiguous answer to the most important question of a manager – for instance:<\/span><\/p>\n\n- “Where are the bottlenecks in production or logistics?”<\/li>\n
- “What will buy the top 20 clients and how?”<\/li>\n
- “Are we capable of maintaining our liquidity in the next quarter without increasing the credit line?”<\/li>\n
- “Where are the largest deviations from the budget?”<\/li>\n
- “Will we meet our sales targets, and if miss them then where and by how much?”<\/li>\n<\/ul>\n
– “Early warning system” for adverse events occurring in your business <\/span><\/p>\n– Facilitates the decision-making process. <\/span><\/p>\nTo increase the level of understanding of information, a dashboard should be interactive and should let every user: <\/p>\n
\n- mine data<\/strong> – to discover new dependencies in data sets that have not been previously known to the recipient<\/li>\n
- filter<\/strong> – to provide the user with filtered and personalised information, depending on the needs and role<\/li>\n
- compare data<\/strong> in different cross-sections or aspects – such as benchmarks of different regions, products, teams, time periods, plan and execution, etc,<\/li>\n
- export<\/strong> – to enable the user to export data from the dashboard to a file (such as PDF, CSV).<\/li>\n<\/ul>\n
\n
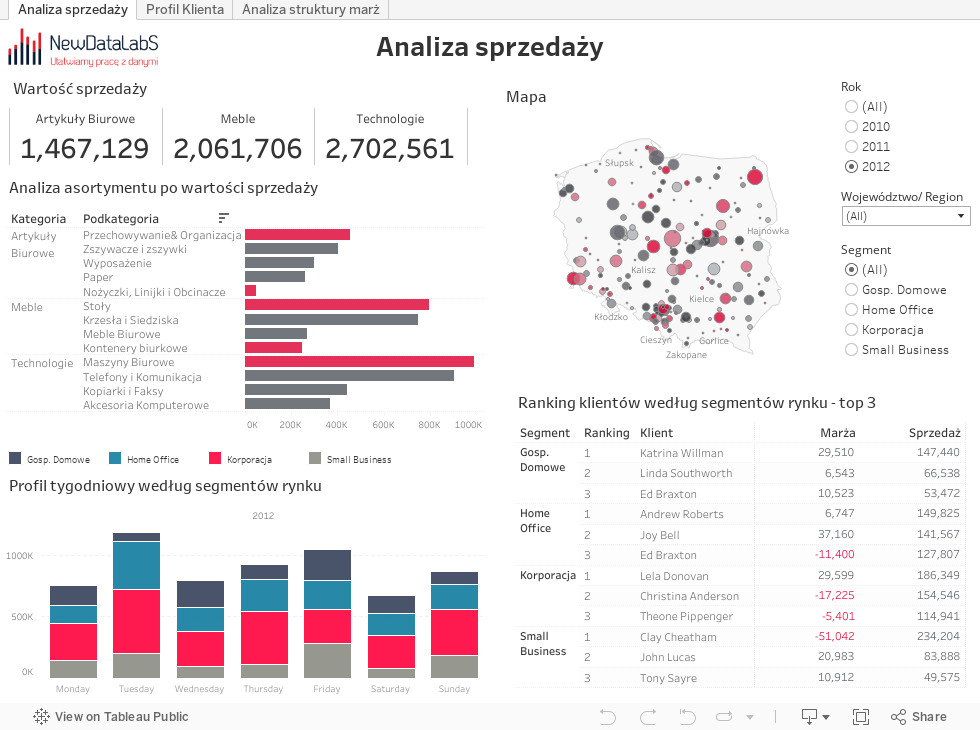
Check out this example of the management dashboard<\/strong>.
\nTry the interactive dashboard below<\/span> and discover how you can work with Tableau.<\/span><\/p>\n