URL actions are one of six actions available for selection in Tableau. This is a hyperlink that allows you to use this type of action in many ways. The primary use is to navigate to a web page in a browser or to a Web Page object in Tableau. Using URL Actions we can navigate between dashboards, pass filters, parameters and fields, create PNG, PDF and CSV files from a published dashboard and even prepare an email containing fields from our dashboard! We can also choose to make the toolbar and navigation bar visible in the dashboard we are linking to. Using URL actions we can increase the interactivity of our reports, making them more attractive to the user and facilitating the analysis. Especially important is the ability to connect other systems to Tableaureporting. For example, by clicking on a contract number on a report, we can pass it to the CRM URL where we display the contract details. Using URL actions will not only make it easier for users, but also faster.
Create URL action
The URL action can be added in the Dashboard (CTRL+Shift+D > Add Action > Go to URL…) or in the Worksheet (CTRL+Shift+A > Add Action > Go to URL…). Once these steps are completed, a window will appear that allows you to select the action settings:
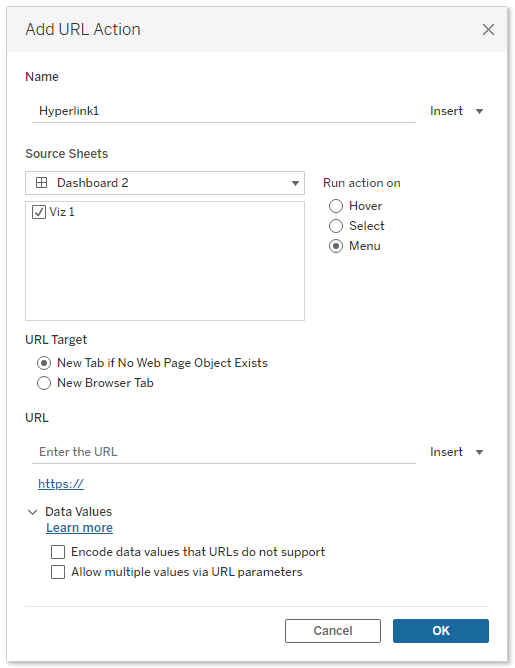
The options we can set in the dialog box are: Name – the name of the action, Source Sheets – selection of objects that will trigger the action, Run action on – what action will trigger the action. Here we have three options to choose from: “Hover”, (hover the cursor), “Select” (selection), “Menu” (after selecting the object, a window will appear from which we can call the action), URL Target – selecting one of two options – “New Tab if no Web Page Object Exists” or “New Browser Tab”. This choice differs only for situations where we have a “Web Page” object in the dashboard. Then, after selecting the first option, the URL will be passed to this object and the page will be displayed on it, while when the second option is selected, a Web browser window will open. In other cases, these options are no different, URL – the URL address we want to navigate to. Optionally with the values we want to pass (filters, parameters) or other settings (such as hiding toolbar and navigation controls),
Data Values – “Encode data values that URLs do not support” allows you to choose whether you want to convert characters that URLs do not support to ones that are understandable and allow you to pass the correct URL. “Allow multiple values via URL parameters” is an option that allows multiple values to be passed to the URL. This choice depends on whether the page we are linking to can receive multiple values using parameters in the URL.
Passing filters, filter actions and parameters from one dashboard to another
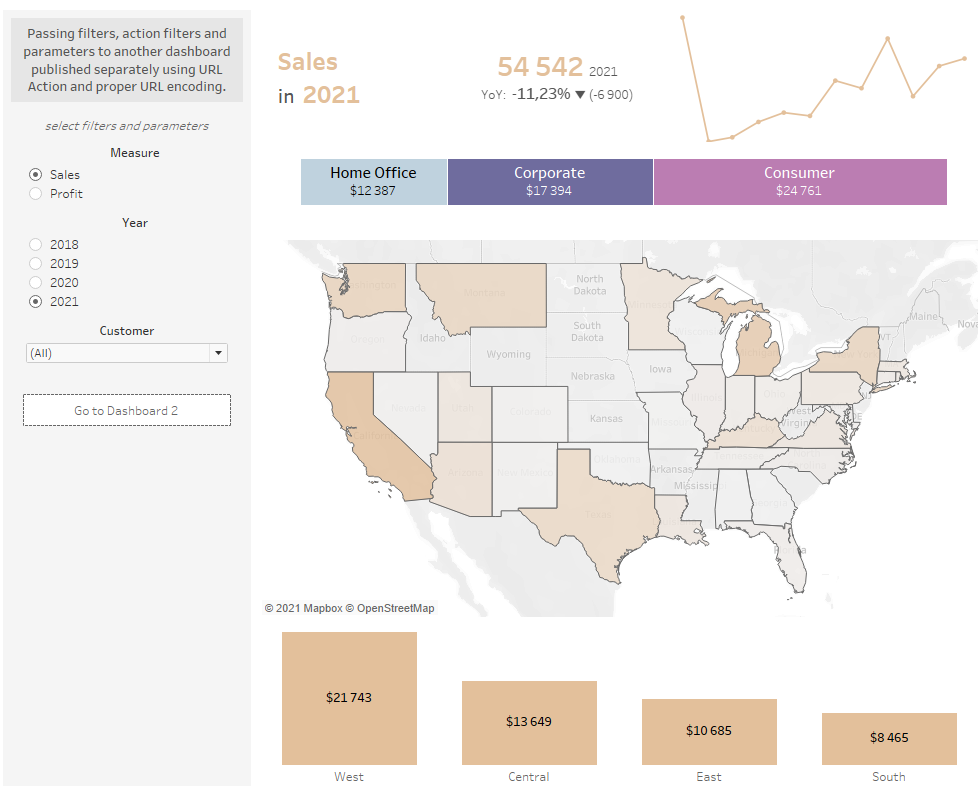
In this article, we will look at one of the uses of URL actions. We will pass filters, parameters, and filter actions from the “URL Action 1″ dashboard to the “URL Action 2” dashboard (and vice versa). Both dashboards have the same data source, but are in separate workbooks. The “URL Action 1” dashboard consists of six objects: KPI (result for the selected year and comparison to the previous year), granular time trend by month (for the selected year), cumulative bar chart by segment, detailed maps for states, bar chart by region, and “Go to Dashboard 2” button.
Dashboard “URL Action
1″ https://public.tableau.com/app/profile/edyta.pawlicka/viz/URLActionl/URLActionDashboardl There is a selection bar on the left side:
Measure – this parameter allows you to select the displayed measure (Sales or Profit), Year – the year selection parameter is active for all objects,
Customer – multiple choice filter with customer selection. This is a Quick Filter applied to all objects in the dashboard.
For the second dashboard, we want to pass the two parameters and filter mentioned above. In addition, we will pass filter actions. They are defined as in the figure below. The objects that filter out all others are the map (states), the cumulative bar chart (segment), and the bar chart (regions).
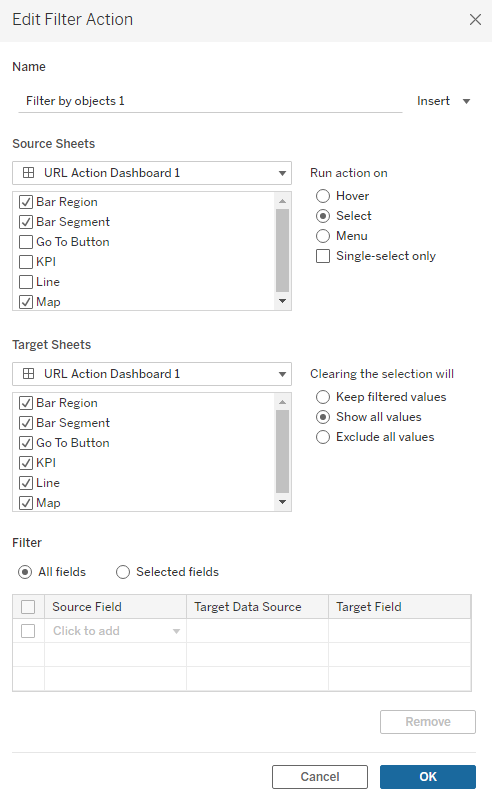
Filter actions in the Dashboard “URL Action 1″
The “go to” function – transferring items with a single click
To convey all these elements with a single click, prepare a separate object (“Go To Button”) to mimic the button. To do this, I created a string type calculation defined as the text ‘Go to Dashboard 2’. I put the calculation in the rows. A very important part of this exercise is to put in the Marks of this object all the fields that can constrain the dataset we want to pass to the other dashboard (as Detail). That is, there must be Segment, Region, and State fields (because these fields can be filtered out with filter actions) and a Customer field that can be filtered out with a simple Quick Filter. Additionally, I set Marks as Circle, color with Opacity = 0% and for Size, I move the slider to the extreme left. I also hide the header (right > Hide Field Labels for Rows) and all lines from the object. Finally, I adjust the width of the caption so that it is in the middle of the button (I check in the dashboard).
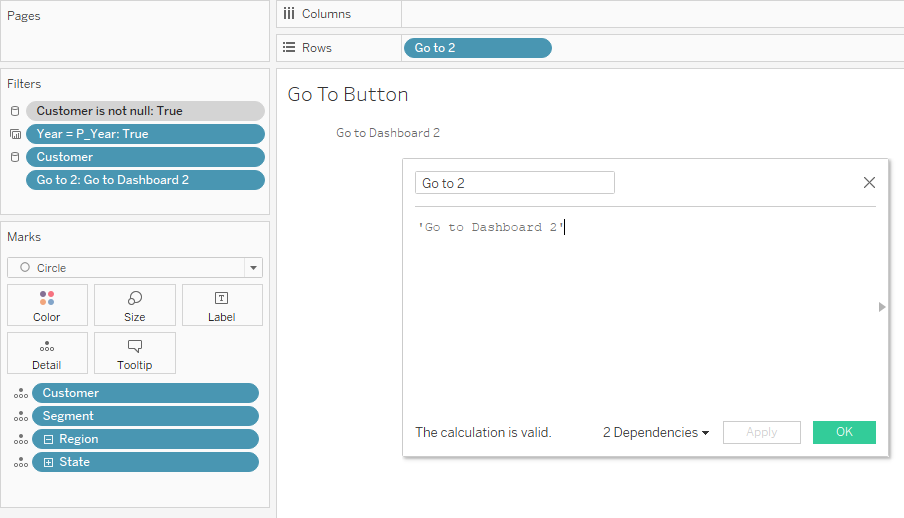
“Go To Button” Object in the “URL Action 1” Dashboard
URL actions – creating in the dashboard
The next step is to create a URL action in dashboard 1, the source of which is the “Go To Button” object. In the URL field, you should:
paste the link to dashboard 2 (you have to publish dashboard 2 before) – the part marked in grey and add a question mark at the end,
pass parameters using the syntax ParameterName=<Parameters.ParameterName> – the part highlighted in blue. If we have more than one parameter, we concatenate the subsequent ones with the & sign,
pass filters using the syntax NameField=<FieldName> – the part highlighted in yellow. If we pass both filters and parameters, we use the & sign to combine them.

We remember to check two options in “Data Values”.
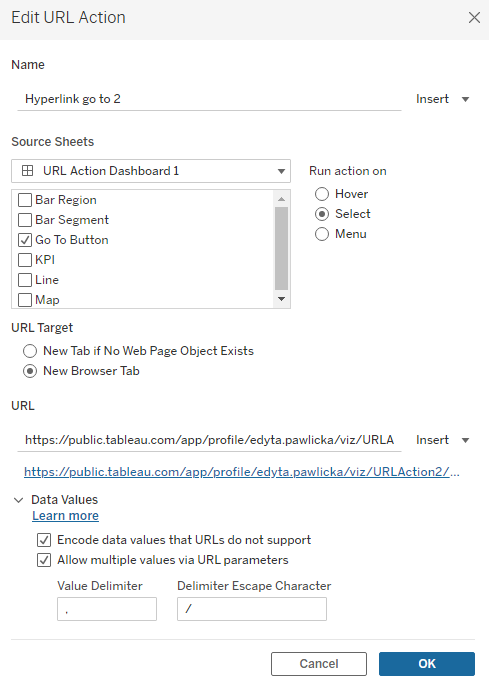
URL Action in Dashboard “URL Action 1”
The “URL Action 2” dashboard consists of five objects: KPIs (number of customers from the selected year and comparison to the previous year), time trend of the number of customers in granularity by month (in the selected year), cumulative bar chart by segment (the measure is the number of customers), bar chart with customers sorted by the measure selected in the “Measure” parameter and the “Go to Dashboard 1” button.
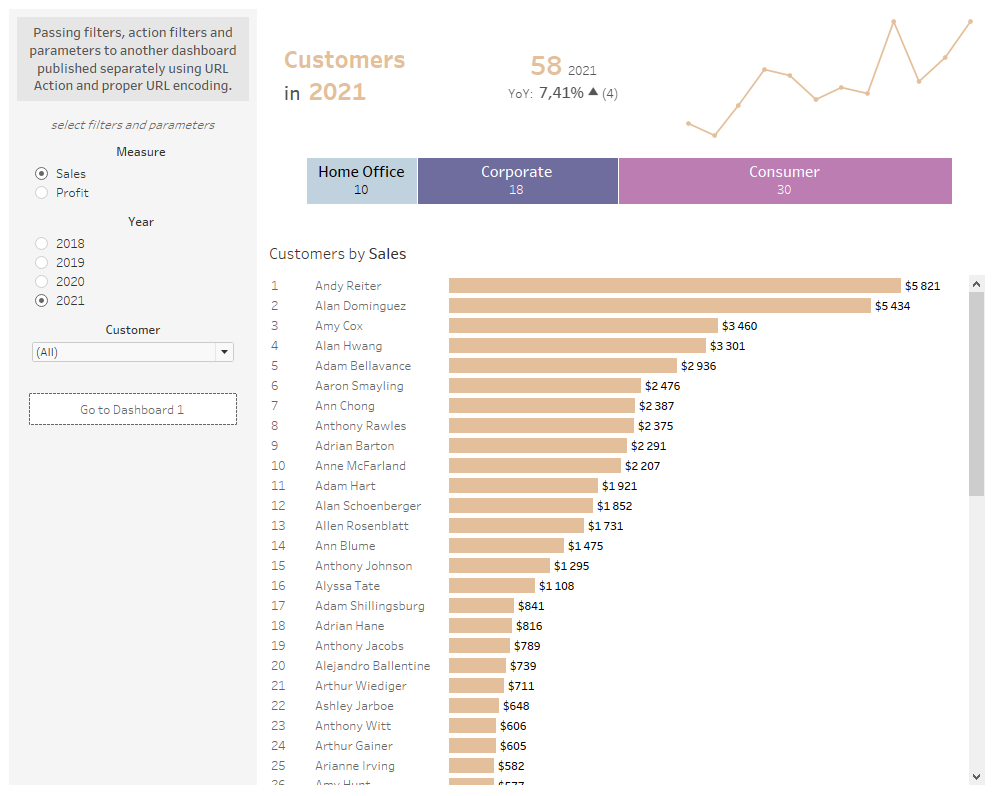
Here we follow the same procedure as in dashboard 1. Our URL action will take a similar form (only the gray part with the address of the published dashboard differs, since we pass the same parameters and filter):

The “Go To Button” will be different. We’ll only add the Customer and Segment fields to the detail, because we don’t have the Region and State fields on any object to filter out the views for us.
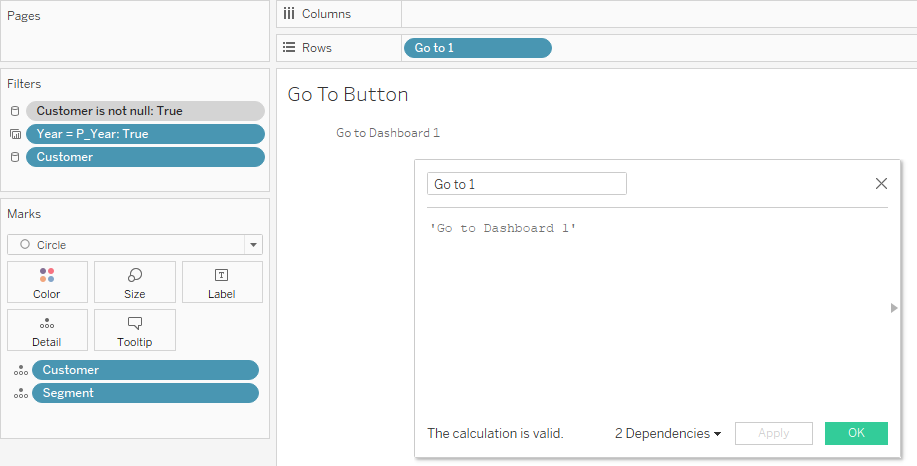
“Go To Button” Object in the “URL Action 2” Dashboard
The URL action differs slightly – our source in this case will be two bar charts (Customers Bar and Segment Bar).
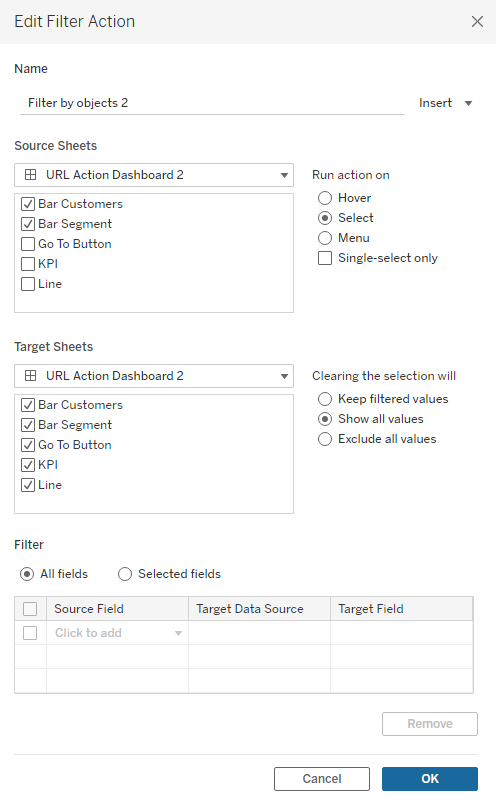
Filter actions in the Dashboard “URL Action 2”
URL actions-how to get links to dashboards?
To get links to the dashboards you need to publish them beforehand without URL shares. We then add the URL action and publish again overwriting the existing dashboards. We test the operation – we change the parameters from the default setting. For example, we select Profit and Year 2020, a few customers from the filter, and Consumer Segment from the object. We click on the “Go to Dashboard 2” button and we are redirected to the second dashboard with the appropriate selection. We can check how the link was constructed in the browser:

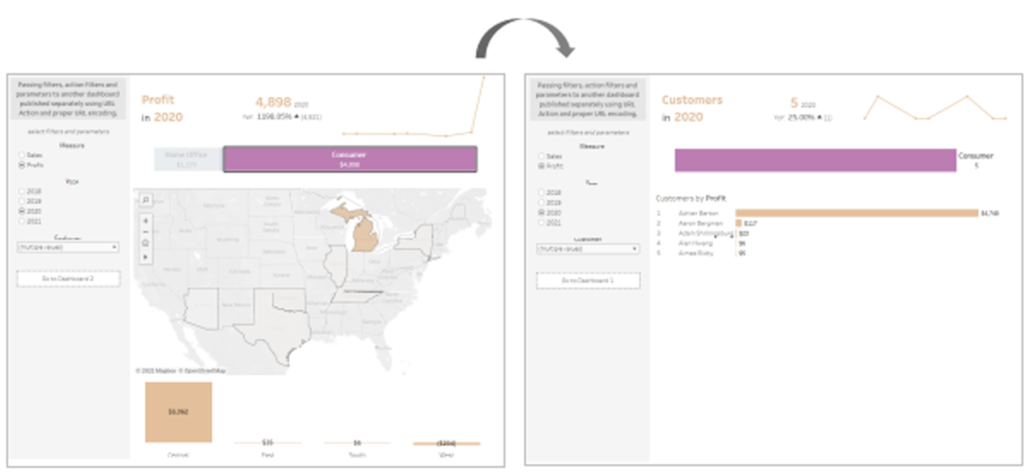
In summary, this type of solution can be used when we have complicated and inefficient dashboards (e.g. containing a large number of calculations – especially LOD and tabular). You can then divide the workbook into individual dashboards and limit the calculations to only those that are necessary on that dashboard. Next, we prepare a URL Action and – redirect button that will allow us to maintain a connection between these dashboards and avoid the user having to repeatedly select filters, filter actions and parameters.
Edyta Pawlicka
Tableau Consultant
