In a previous post, I discussed the concept of ETL (Extract, Transform, Load) tools along with a description of the Tableau Prep application. Continuing the topic, in the following post I will introduce the characteristics of Power Query (an add-on to Power BI) and summarize both tools.
PowerQuery as an integral part of Power BI
The first major difference between Prep and PowerQuery is their integration – Prep is a separate application and Power Query is sort of part of PowerBI. We start PowerQuery from the ribbon after starting PowerBI by selecting the Transform Data command:

Running PowerQuery makes you feel at home right away. The tool has an interface well known from other Microsoft applications, namely the command ribbon. It’s easier to learn how to use with Excel experience.
The interface is a bit rougher than in Prep and may remind you of other Microsoft applications (such as Access). While in Prep the flow of data came first, in Power Query it is data: Individual elements of the Power Query interface:
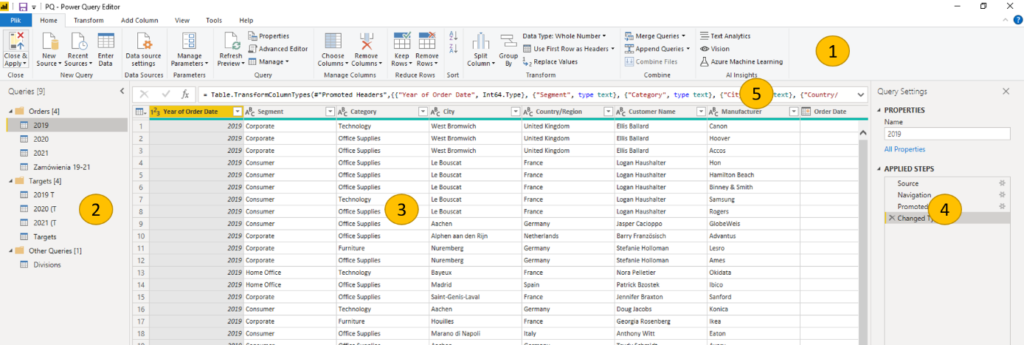
- – command ribbon
- – list of data connections
- – data view
- – list of transformations that model and transform our data
- – formula bar
Extract, Transform and Load in Power Query
Decomposing the ETL process in PowerQuery, the different phases occur:
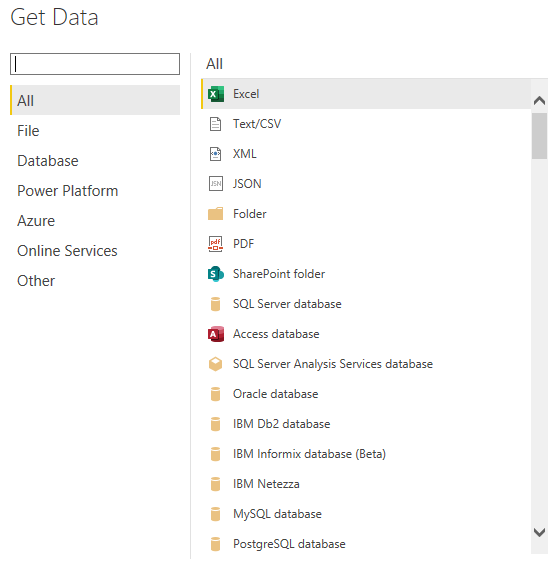
Extract – data connections. The list of connections, as in Prep, is quite broad – through text files, excel, through data warehouses, data lakes to cloud solutions:
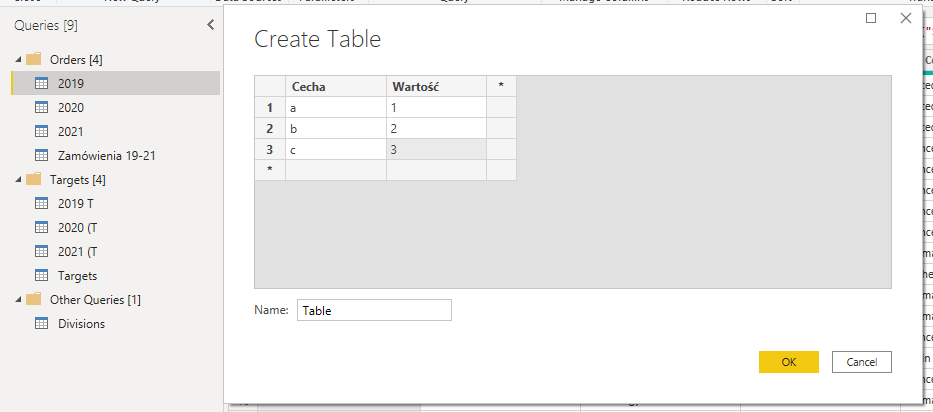
In this area, PowerQuery has two useful functionalities. First, we can manually enter data into a table that will then be used in our model. Second, we can organize sources into folders, which makes navigation much easier when dealing with complex models:
We model data in Power Query
Transform stands for data modeling. As in Prep, the list of available transformations is extensive. We have the first commands available on the Home ribbon:

Manage columns – select the columns we want to keep in our data. Of course, it is good practice to keep only the fields we need.
Reduce rows – decide which rows to keep (e.g. first 1000) or remove (e.g. duplicates, empty) Sort – sort the data
Transform – basic commands that are more broadly available in the Transform.
Combine ribbon – joining tables. Two options are available: append, which is appending tables of the same structure one below the other, or merge, the equivalent of join.
More detailed data modeling commands are available on the Transform ribbon:

The individual components allow for:
Table – setting the first row as headers, grouping, transposition Column – depending on the column type:
Any – model data type, replace values, pivot columns, move Text – split, format, extract
Number – statistical, mathematical, scientific Date & Time – date and time functions (year, month, quarter, etc) Scripts – possibility to run R or Python scripts
More items are available in the Add Column command ribbon:

General – add calculated, conditional or index columns
From – create columns based on our data, similar to transform: from text, number, date & time.
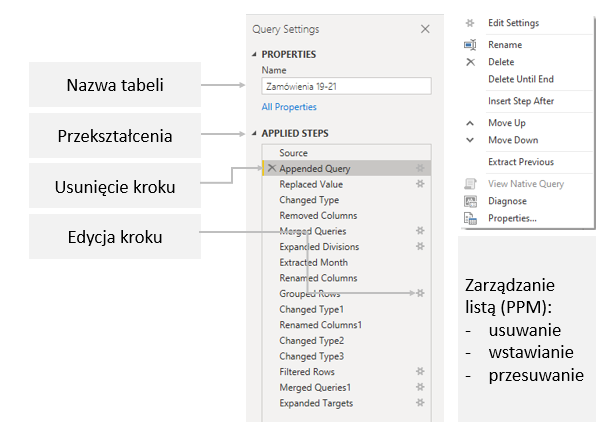
Al insights – using Machine bearing algorithms, analogous to Einstein Analytics in Prep The list of transformations is available in the Applied Steps pane. There we have available a chronological list of all transformations performed on our data. Importantly, you create the steps only once, and then when you refresh the data, the transformations are done automatically. Once saved, you can modify, move, delete and insert new steps. We can also rename each step to make it easier to see our transformations.
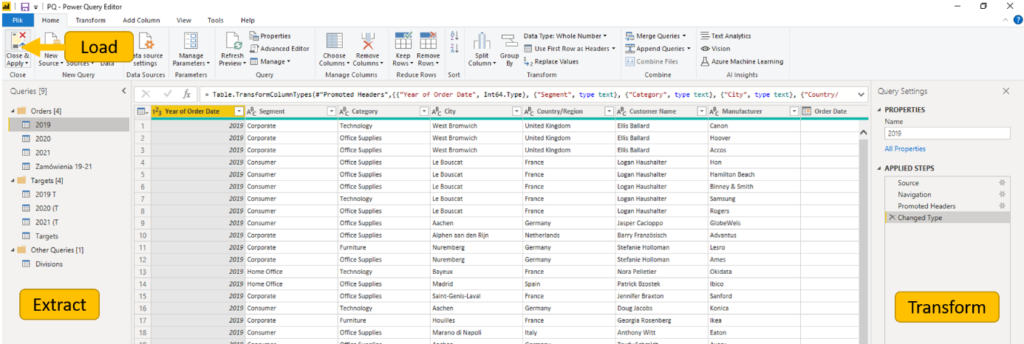
The final step, Load
The final step in the ETL process is to load the data for further analysis. In PowerQuery, this is done by selecting the Close & Apply command from the Home ribbon. The data will be loaded into PowerBI, and we can proceed with visualization and analysis. If this and only this effect is what we wanted, then the solution is most satisfactory. The problem arises if we would like to export data from Power Query/Power BI to analyze it in another application or load it into another database. There are quite a few limitations here. First, for row counts over 1M we need an external application (such as DAX Studio). For a smaller number of rows, we can use the classic copy-paste with PowerBI/PowerQuery, paste into Excel, and save as a csv or xlsx file. It seems that with all the sophistication of BI tools, having to manually copy data is a bit of an outdated method. The load stage is set in this situation typically for further analysis in PowerBI, not in any other systems.
OK, is it TableauPrep or PowerQuery?
Of course, there is no clear answer to a question like this, just as there is no clear answer to Tableau or Power BI. Prep is a more visual tool, making it easier for us to see the flow of data. PowerQuery offers a rougher interface, which may also have its supporters. The two applications have a slightly different focal point – in Prep it is the data flow, and in PowerQuery it is the table of transformed data. Note that PowerQuery is integrated directly into PowerBI, while Prep is a separate application. So we load data into Power BI with one button, and in Prep we need to export extact and then refresh it in Tableau. This takes longer than exporting Power Query -> PowerBI. On the other hand, Prep makes it easy to export data to local files. Both tools are certainly great additions to self service BI and definitely do their jobs in preparing data for visual analysis.
Mateusz Karmalski, Tableau Author


