In visualization, bar charts can be used for almost everything, which makes them the most universal of all graphs. Moreover, recipients can intuitively understand what they convey. They are simple and easy, however, it’s worthwhile to keep in mind some aspect.
Bar chart: a gift from the gods
While reviewing Twitter, I came across the post written by the visualization consultant – Steve Wexler, who wrote:
“A bar chart is the gift from the data visualization gods that allows ordinary people to make accurate comparisons without needing to study science. But if you cut the value axis, you will bring the goods’ anger on you (and you will let your audience down).”
Today, I’m going to explain what can be illustrated by using bar charts. I will also advise how to avoid the “anger of the gods”.
According to the Financial Times’ chart classification, there are 9 main applications of charts. The bar chart will always work for five of them and can work for two or three more if you modify or enhance it. It will hardly work for maps and for illustrating flows.

Let’s compare it on the bar chart!
Chart bars are usually used to present all kinds of comparisons. Going back to the aforementioned classification, these are mainly comparisons of various categories over time and illustrate the intensity ratings. Our vision is well prepared to compare section lengths and we intuitively understand such visualizations. We can also easily estimate the relationships on their basis. There are only two “but’…” First of all, it’s good to have the elements for comparison arranged next to each other. Second of all, it’s important to have the correct chart scale.
The following illustrations show two charts built on the same data. The difference between them is what they emphasize. In the first case, it is the evolution of the sales time in each region. In the second, it is the ranking of regions in each year. This example shows how to combine the data to deliver the right message.
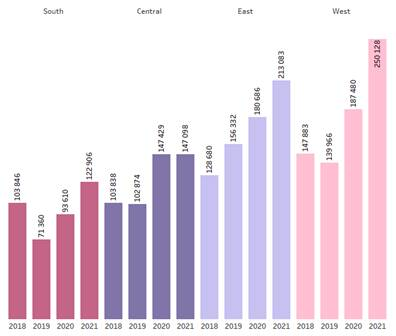
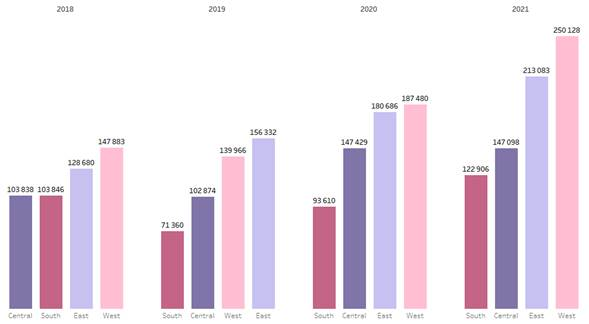
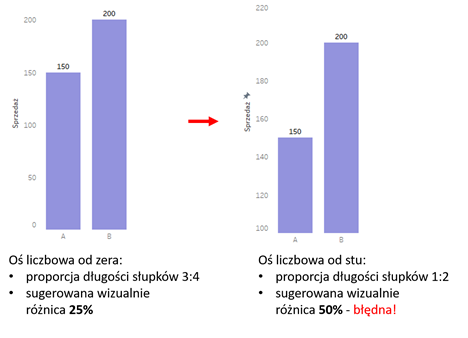
Is it possible to spoil such a chart? Yes! And this can bring the anger of the gods of visualization. The worst sin in creating bar charts is to change the scale of the numeral axis and exclude zero. This will change the proportion of the bars. We usually don’t look at the numbers, but we analyze the situation based on the illustration. As a result, the problem may seem to be much more serious or trivial than it actually is. Political parties often use this technique. All over the world, and by all political sides. They can easily get a terrifying scale for a decline of a few hundredths of a percent.
Podium steps – chart bar in ratings
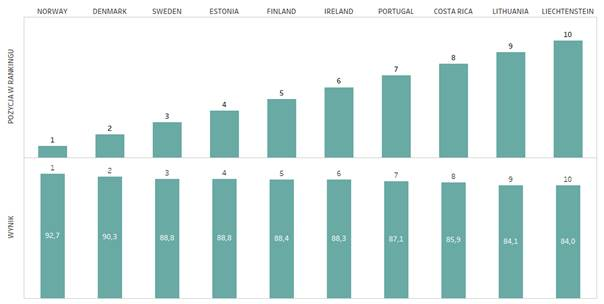
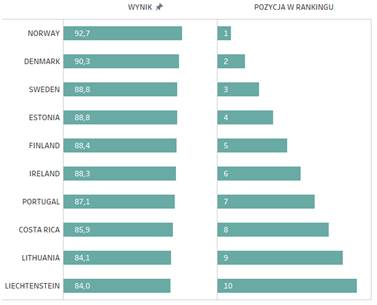
A bar or column chart is a perfect choice for presenting ratings. However, when using vertical bars, you need to keep in mind that their size will not correspond with the position in the ranking. The better the result, the podium step will seem to be less impressive. You can solve this issue in two different ways. First of all, you can link the size of the bars with the result. The better the score, the higher they get. The second option is to illustrate the ranking with horizontal lines. This way leaders will be on the top.
Bar charts and deviations
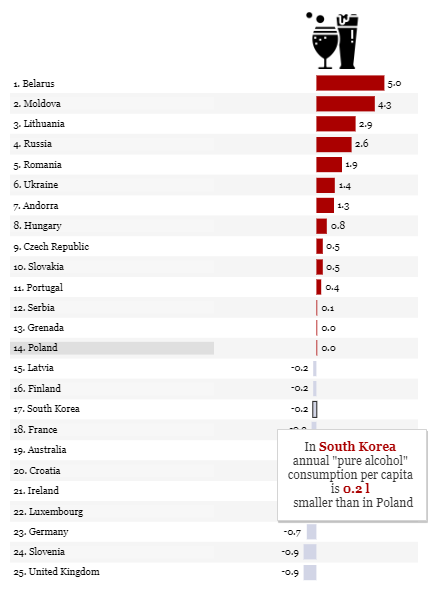
Another visual category which you often work on is the illustration of a deviation from the specific norm, and bars are very helpful in this case. You should remember that in order help your audience read the chart correctly, they need to know what this norm is.
A piece of cake: a part-to-whole ratio
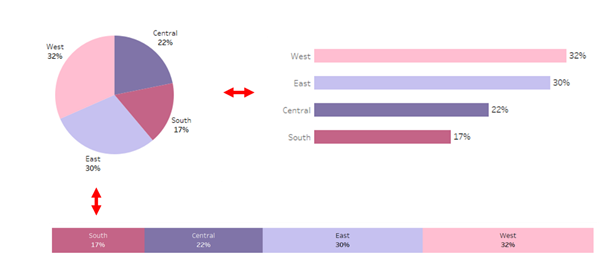
Another interesting issue is to know how to present a part-to-whole ratio. Usually, it is illustrated on a pie chart or a tree map. However, the bar chart can also be a fine choice here. Why? We intuitively associate the first two graphs with the elements of the whole. But when you need to estimate what part a particular element is, bar charts will be the best of all.
Correlations – maybe not directly, but a bar chart
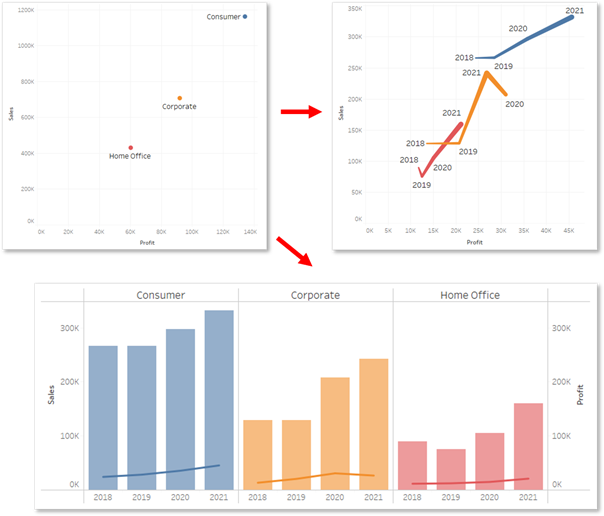
The last two visualization categories according to the Financial Times are correlations and flows. The bar chart on its own is not sufficient, but it will work if it is combined with the line chart. Let’s start with the correlation of two measures. We usually present it on the scatterplot chart, however when you want to show the dynamics of the correlation over time, this option is no longer intuitive. In this case, you can combine both the line chart and the bar chart.
All analysts may have moments of doubt when considering the use of the bar chart for the hundredth time. However, there is no point in resigning from them. Their universality as well as simplicity to create and interpret them are invaluable.
Agata Mężyńska, Tableau Desktop Certified Professional
