The world is changing, so is the Financial Controlling. People change. Everything is moving fast, we have less and less time, but increasingly more information to be processed. The cognitive and computing abilities of our brain (more precisely its intellectual processing of information) are just too limited to deal with the processing of billions of data records.
Financial Controlling and subconscious processing of information
Have you ever tried to find the largest value in the table with 20 million rows and 100 columns? Try to do that, and you will understand what I am writing about…
The good news is that … we have enormous resources. Our brain works (processes the information consciously) usually using 20-30 percent of its capacity. The remaining part is used to „keep the system going” – to make sure the whole organism is up and running without our conscious control. For example, the digestion process, fighting infections, the reaction to cold/warm, the reaction to stimuli, the body energy system, etc. One of these functions is subconscious processing of information.
In this regard, our brains are surprisingly fast. We don’t have to wonder, if it’s bright or dark outside. If something is large, small, black, red, square or round. Or if it’s on the left, on the right, still or moving. All of this is straightforward – the information is processed subconsciously, tens of thousands of times faster than such stimuli as text or numbers.
12576
Visual perception and short-term memory
Data arrive to us through such mechanisms as visual perception and short-term memory (but nothing comes for free – we instantly process this type of information, but we usually remember it for a very short time).
To function in the world of the increasingly faster circulation of larger and larger data volumes, we need to learn how to handle the information. We must be able to effectively process data and rapidly draw conclusions.
8 ways to process data and draw conclusions
We must learn how to:
- Filter the information and don’t touch the irrelevant information
- Draw conclusions and interpret events rapidly
- Be able to overlap the information from various sources/domains (which may sometimes be contrary to point 1)
- Be concise and precise when communicating.
- Be inquisitive about finding the causes of specific circumstances – the question “Why” should be framed and hung above the desk of all controllers!
- Personalize information – different people would want to learn about different aspects of the same data (e.g., sales data).
- Always reference the source and bear in mind the metadata (data about data). Such information as:
- “The date of the data” (date/time of the underlying data)
- The source of data
- The number of analyzed records
- The number of null records without the appropriate description may impact (or not) the reliability of the entire set of analyses that are presented.
- Remember that the “One Page Reporting” approach isn’t about decreasing the font size and squeezing more tables into one page. The point is to show on one page/screen the key information that is relevant to a specific decision-making aspect. You must also have extensive knowledge and experience to be able to design an interactive and legible “One Page”.
Financial controlling and the work of a controller
Financial Controlling was invented to optimize business processes so that they are more agile and efficient. It was not invented for the purpose of comparing the plan with the performance to explain where the deviations come from.
Stefan Olech always points out that the controller cannot act like a bean counter. The controller should be a sparring partner for the management, asking difficult questions and finding answers to them.
Inevitably, the work of the controller has been evolving towards “a data man”. The good news is that the data analysis is becoming increasingly easier. As technology gives more and more opportunities, even managers will become better and better at data analytics.
A few years ago, one of the topics discussed during the Controllers Conference was the necessity of learning the SQL. The good news is that it’s no longer needed… The technology of the visual data analysis has advanced rapidly, and today the questions or queries are automatically processed after selecting the relevant options in the interactive dashboards.
Data Governance – preparing data for analysis
Data modelling is also becoming more and more advanced – preparing the data for analysis, the ETL, and the Data Governance as well as managing the access, rights ,etc. The involvement of the controllers will continue to increase in these areas.
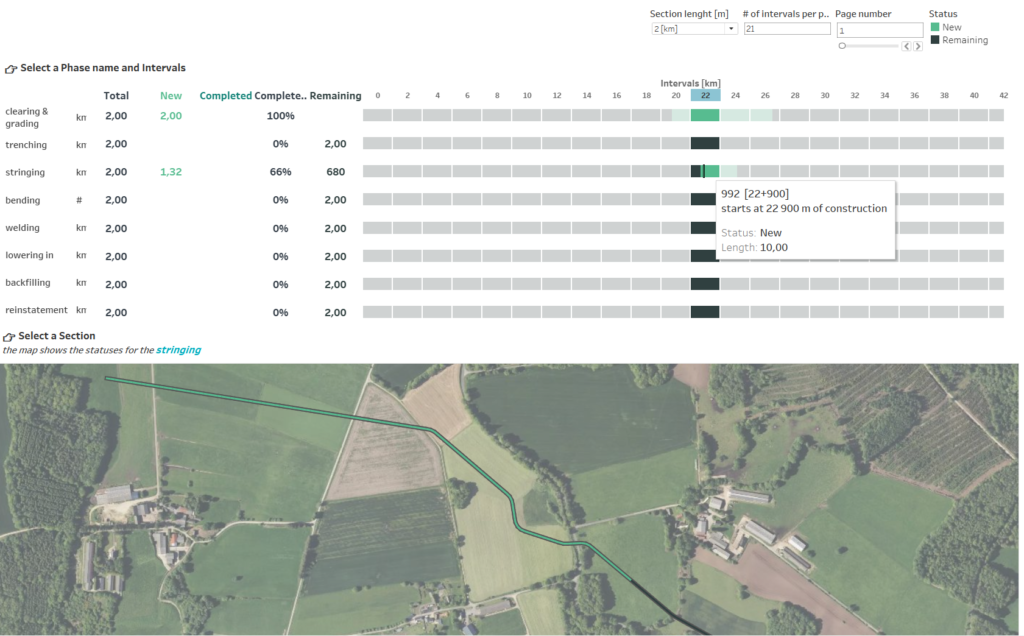
Let’s add also other megatrends here, such as the IoT – Internet of Things. Who would have thought of using … drones in the controlling a few years ago? Yet, this is the case… One of our Clients utilizes drones to monitor the progress of large infrastructural investments, such as the construction of motorways, pipelines or photovoltaics farms. Every week a drone is sent out to these construction sites. It is set on the same XYZ coordinates (latitude, longitude and height). It then takes a high-resolution digital picture. Next, the picture is analyzed using the AI algorithms to identify what has changed since the last measurement. They check the progress of works to determine if a given phase is completed or not. The data is used to generate the input file for our dashboard. Within 2-3 hours from the time of the picture, the file can be published on the server and shared with the project manager through www or a mobile device. From the perspective of the end user the dashboard is very simple – try to imagine the execution of a similar project using traditional methods…
Embedded Analytics
Another megatrend – Embedded Analytics. Several years ago, the concept of exchanging data with your business partners would be considered at least strange. Nowadays many of our Clients safely share their data with the help of technology. They can share with their suppliers/customers/distributors/partners/franchisees such details as stock levels. The fact that both sides can look at the same REAL-TIME data, updated at the same frequency, can bring many benefits. It makes it much easier to:
- Harmonize the supply chains
- Optimize the stock levels
- Manage the incentive programmes
- Measure the OTIF
- Or simply … monetize the data.
Data Monetization
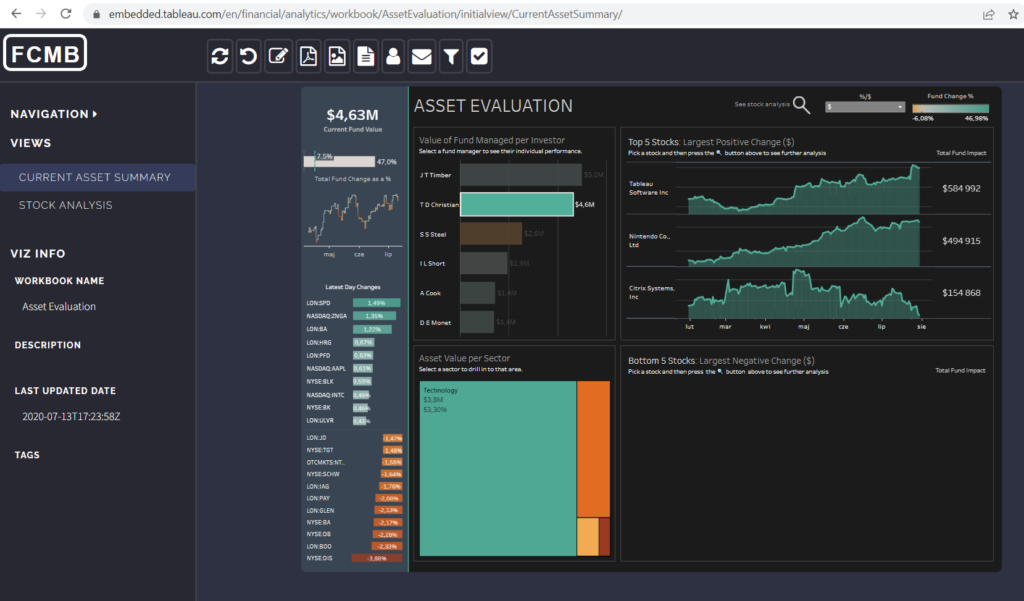
Data monetization is another megatrend. A few years ago, it was unthinkable. One of our Customers, a large network of hypermarkets was concerned with the old backup of the checkout systems. They didn’t feel comfortable with discarding it, so they decided to … make money on it. We helped them to put the data into Tableau and we also connected the up-to-date information. We built together a set of analytical dashboards. They are able to perform thorough analyses of sale of products from their over 6000 suppliers in this network. They also enable to meticulously analyze the trends, seasonality, geographical distribution, shares in specific product categories, position compared with competition, etc. Moreover, these are not estimated figures as in the case when you buy costly research data from the well-known research companies. This way a very innovative service was developed, which the hypermarket network has been offering to its suppliers. It has attracted a high level of interest. The project has become a major success and has proven that data monetization is not just empty talk.
Machine Learning, and the controller’s work
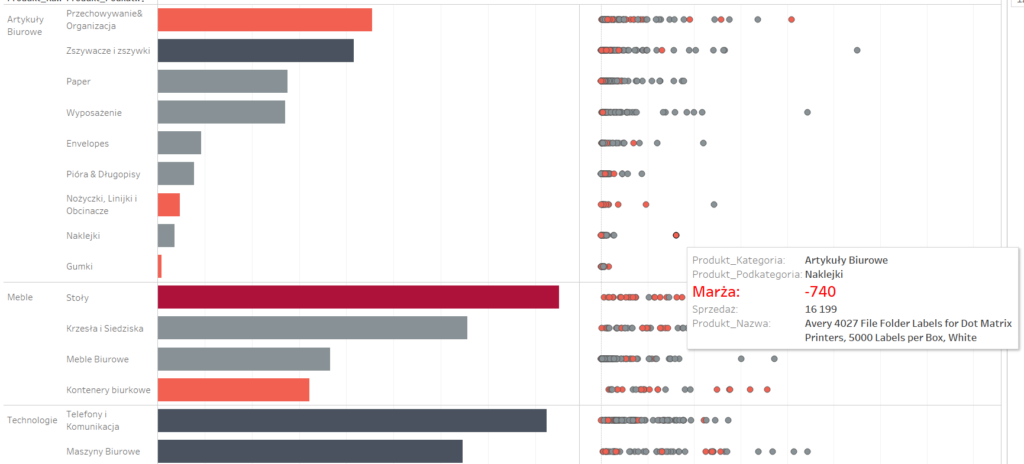
What about Machine Learning? How does it apply to the controllers’ work? It simply helps them answer the most important questions in their job – those starting with “Why?” Several years ago, when we presented to our Clients the capabilities of the visual data analysis, their had their eyes wide open. They were even more impressed with the “View Data” option, which allowed them to see what data sources (e.g., documents) were used as a basis for the filtered analysis. Today, in addition to the “View Data” functionality, we also have the “Explain Data” option. It allows us to understand the dataset and shows the “research hypotheses” which explain if a particular range of data differs from the remaining data. You may be selling a lot but earning little because specific shipments/packaging is used more here than in other assortment groups. As you can see, this tool can do a significant amount of work for you, however, intuition and know-how in business will always be highly valued.
Financial Controlling – simplicity as a reliable trend
None of what I have described above may sound easy, however, it is a very straightforward concept. And it’s also an important trend in Controlling – simplicity. You can even say it is asceticism in presenting data. Multi-colour dashboards have long been outdated, as they overload the brain and distort the main message. The best projects we have delivered for our Clients are usually based on 2-3 colours. The good old “accounting” colour palette (red/black) works very well. Dashboards using these colours can clearly show what is right and what is wrong. Where you are losing or gaining, or where it is going up or down. It is worth remembering. Designing effective dashboards for our managers requires expertise and a very good understanding of their needs. The same you need to be a racing driver to drive a rally car. Especially in the early stages, the role of the Consultant is invaluable.
The world is changing, controlling is changing, and business models of companies are changing. Working with data is becoming increasingly important and more fascinating. It also gives a lot of satisfaction – and this is what I wish all of you!
Witold Kilijański
President of the Board
NewDataLabs


