At the beginning of 2020, companies started working remotely and moved routine office tasks to the virtual environment. It is now clear that the previous office jobs will not come back, so organizations must adapt their processes and working tools to the new circumstances. Currently, meetings take place in the digital world. E-mail, chats, alerts and comments have become the essential element of exchanging information between teams or employees. What is the role of alerts and comments in Tableau in the new reality?
Alerts in Tableau as a way to control changes in the organization
Tableau allows you to work together safely in the channels that connect the internal and external teams, and streamline data-based workflows. One of the features is to add alerts to dashboards that help send notifications or share detailed information. You can use alerts to notify users about changes. You may have certain performance thresholds in place, but you want to be alerted when the performance is higher or lower than expected.
The benefits of alerts
-Managing your data from anywhere
Use your data everywhere you need it. Tableau provides safe access to your dashboards – you can use your data through a web browser, computer or a mobile phone.
-Greater involvement of employees
It’s easier to manage the employee involvement from the level of one, integrated platform. The teams must improve the process of knowledge sharing by using dedicated alerts that concern the necessary changes that need to be made to improve the company’s performance and condition.
-Tableau takes the communication between teams to a higher level.
Tableau alerts allow you to improve the communications and work more efficiently from anywhere. New capabilities help create and share data and work on the data in one dashboard.
Setting and configuring dashboards
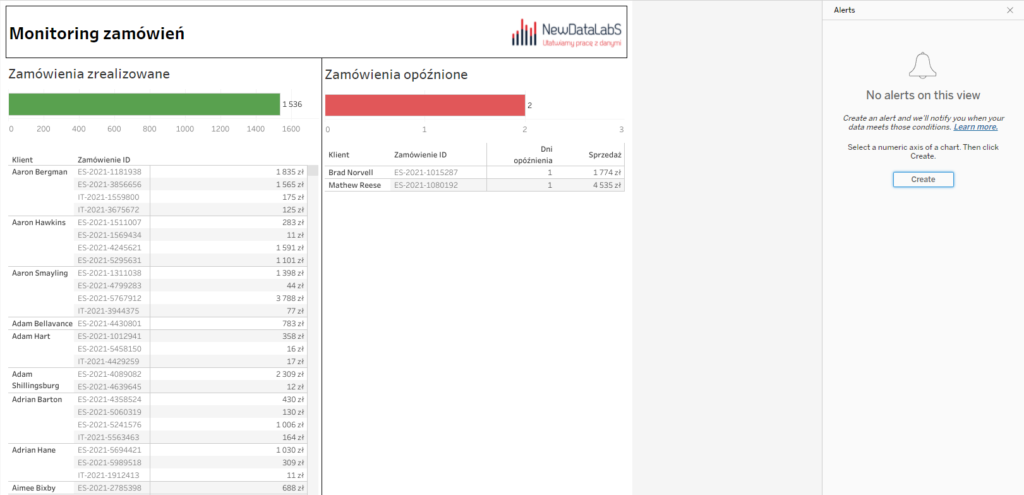
You can use alerts to control the timeliness of shipments. To set an alert, click on the icon in the tab above the dashboard. The alerts configuration screen will appear on the right side.

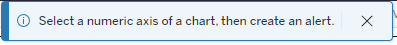
IMPORTANT! To create an alert, you need to indicate the continuous numerical axis to which it should refer. Alerts don’t work in Gant charts, maps and discrete numerical axes. If no axis is indicated on the chart, then when you click the button, the following message will appear: “Select a numerical axis for the chart, then create an alert.”
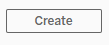
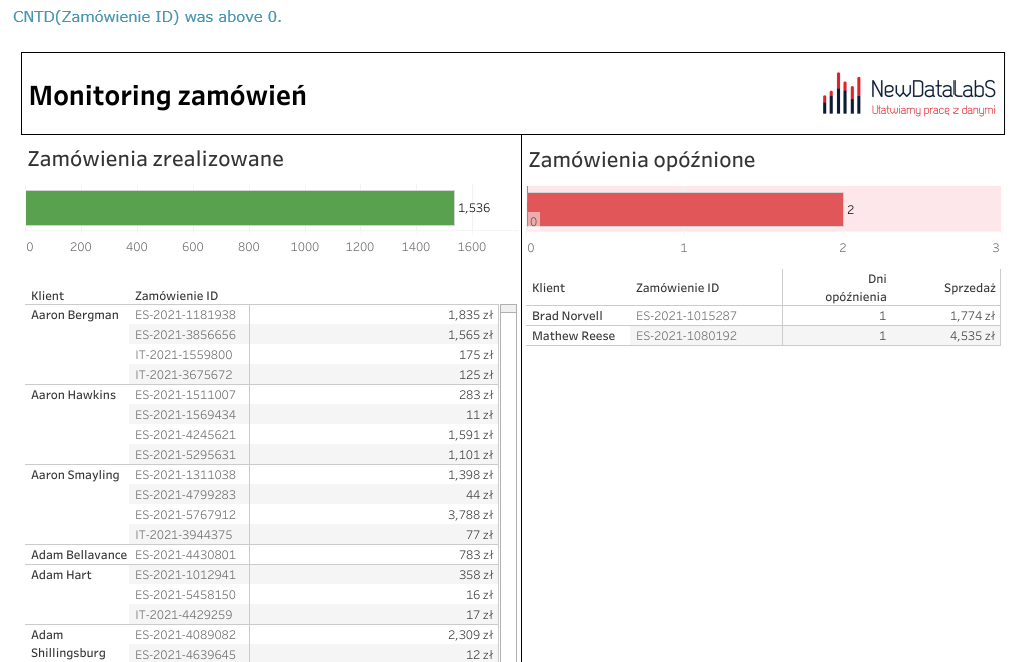
If you want to receive notification, for example when delayed shipments appear, you should select the axis in the “Delayed orders” bar chart, and then click Create in the Alerts pane on the right side.
You can configurate a new alert in the window that pops up.
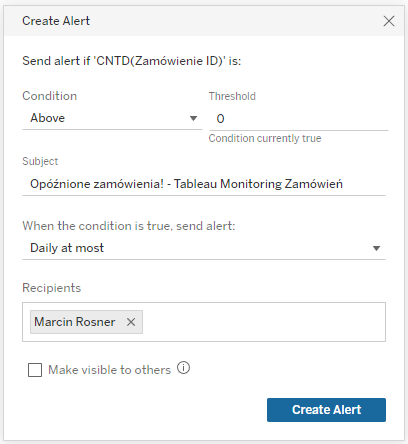
Condition & Threshold – a condition and value needed to activate the alert. The alert in the illustration will trigger an email to be sent if the number of delayed orders is greater than 0. There are also other conditions which you can use.
Subject – Title of an email that will be sent once the alert is activated.
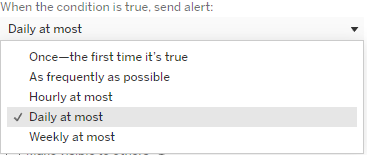
When the condition is true, send alert – frequency of sending alerts. The current setting will trigger one email per day. There are also other options available.
Recipients – users who will be notified about the alert. You can add here Tableau users from your organization. Users don’t need to create separate alerts; they can be added to the existing ones.
Make visible to others – an alert can be visible by all users who have access to the report. This way users will be able to add themselves to the list of alert recipients.
Once the alert has been configured, you need to create it by clicking the Panel Alerts. Your new alert will be displayed on the right side.

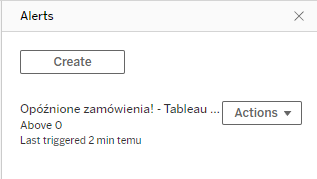
You can edit the existing alerts in Actions.
Remove me – you can unsubscribe from the recipient list
Edit – you can re-configure the alert
Change owner – you can change the owner of the alert
Delete – you can delete the alert
Alert in practice
If the condition specified in the alert is met, an e-mail will be sent to the alert recipients.

The email will contain the condition that has been met and a picture of the dashboard in which the alert has been triggered. You can see that the chart, on which the alert is based, is highlighted in red.
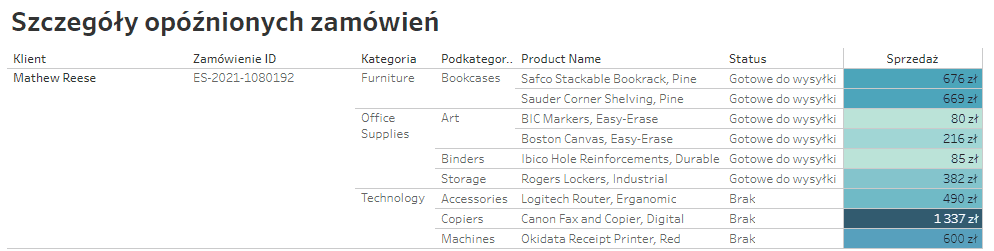
When you click on the picture, you will be directed to the corresponding dashboard, where you can start analyzing the reasons of the delay.
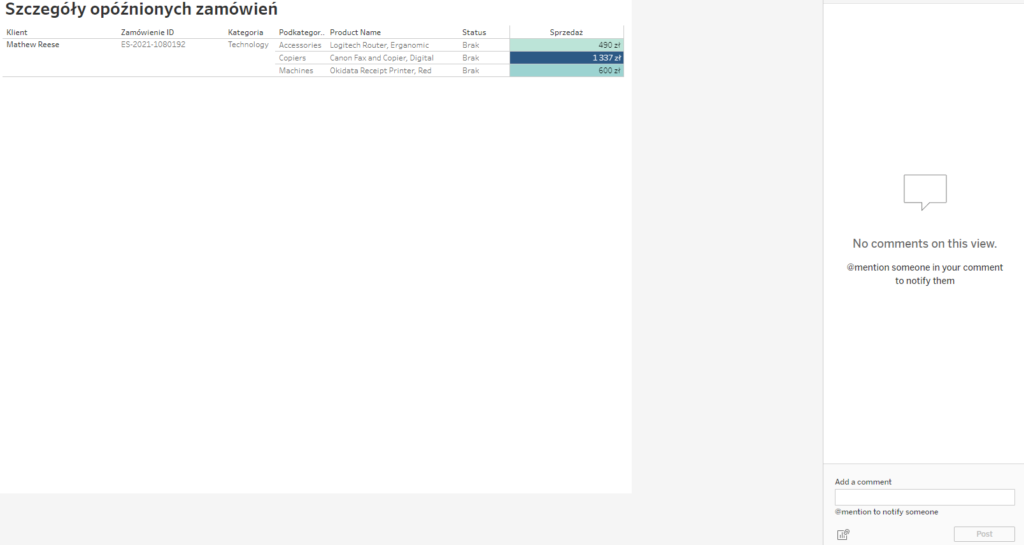
Comments – present the results of your analysis to others
The Comments function allows you to direct another Tableau user to the same view of the report that is being displayed. The user indicated in the comment will receive an e-mail with a hyperlink. By opening the link, the user will be able to view the whole report (filters, actions, parameters) in the same format it is displayed by the user who is writing the comment.
In the details of the delayed order, you can see that the problem concerns the Technology category. By selecting the Keep only option, a limitation will be added to this category.
Next, if you select the icon, the comments section will appear on the right side of the dashboard.
In the comment, the Technology category manager will be marked. To mark another Tableau user in the comment, write “@” and select the required user from the list.
IMPORTANT if you want to refer to the current dashboard view in the comment, click the icon

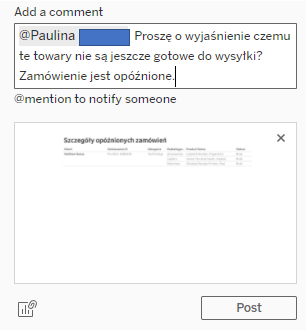
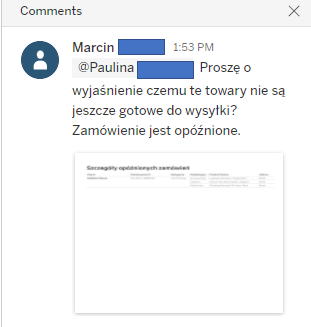
Fig. 1 Fig. 2
When you click Post (Fig.1), a comment will be added to the comments section and all persons listed in the comment will receive an e-mail (Fig.2).
Don’t let the changes in the data surprise you.
Data-based alert is a new, powerful function, which users have been requesting for some time. Tracking and controlling the essential indicators is possible by getting an e-mail into your business inbox. Moreover, you don’t have to keep checking your Dashboard.
It takes only one minute to configure the alert. Be the first one to find out! If any errors occur, you can always fix them. Make sure you receive notifications about anomalies in the data before you manager gets a call from the client.
Marcin Rosner,
Tableau Consultant


