In the previous post, we provided a general overview of Tableau Prep. We learned how to start working with this tool, and how to use and navigate through the interface. We also touched on the data transformation, getting to know the data cleaning step – Clean. In this entry, we are going to discuss further steps of modelling our dataset, starting from grouping, filtering and splitting to creating calculations. As before, the key will be to use Prep daily as a tool to facilitate working with data transformation.
Data grouping
Grouping is needed in various situations, for example, when we want to limit the number of elements in any given field. Looking at our data, we will perform grouping in the Status field – we will group the fields with the brand name and the word Certified in one position. You can do this by selecting the field options, then Group Values and Manual Selection. The final step is to change the name of the group to Certified. This way you will get a field limited to three options. Last but not least – transformation is performed in the existing field, and no new field is created. This allows us to keep the data in order:
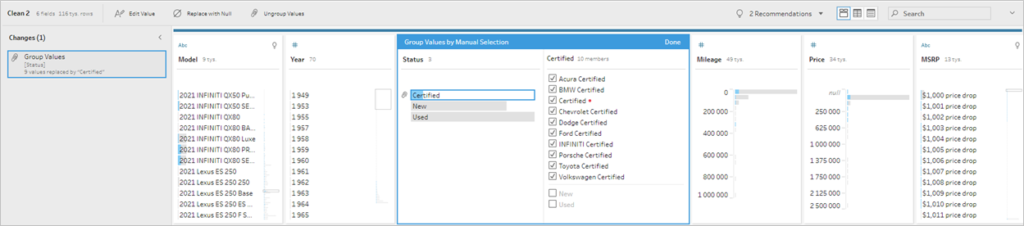
It is also worth noting that the change was recorded in the field Changes, and if you want to edit or remove it at a later stage, it can be easily accessed.
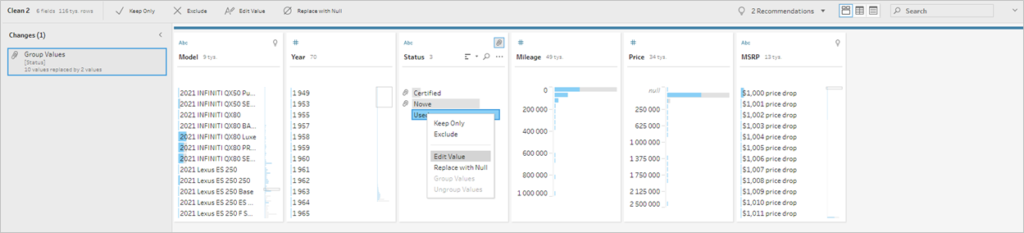
Grouping has one more useful feature – it can be used to change the existing value. Let’s assume you need to change the names from English to Polish. You can also do this by grouping – click the desired value, select Edit Value, and change it as you wish. A clip will appear next to it, which is a graphical indication of grouping. This way you can create a group with one element which name you can edit:
Data filtering
Filtering is one of the basic operations in data transformation that allows us to remove unnecessary items. This way only the applicable data remains, thus making the analysis process less complicated – you don’t need to go through irrelevant information. In Prep, filtering is performed in the Clean Step. The easiest way to do this is to select the options of your field, then the Filter field, where you get the following options:
1 – Calculation – create your own calculation for filtering
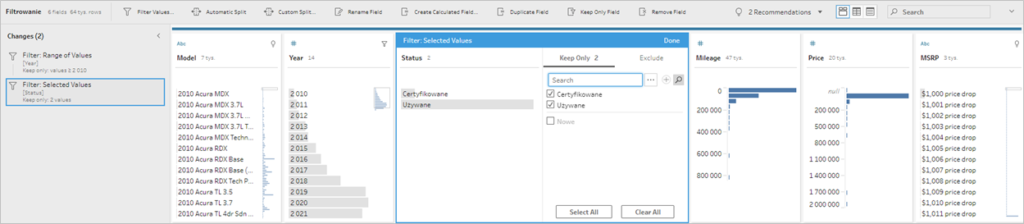
2 – Selected Values – select an element from the list to be kept or discarded
3 – Null values – select to remove or keep nulls
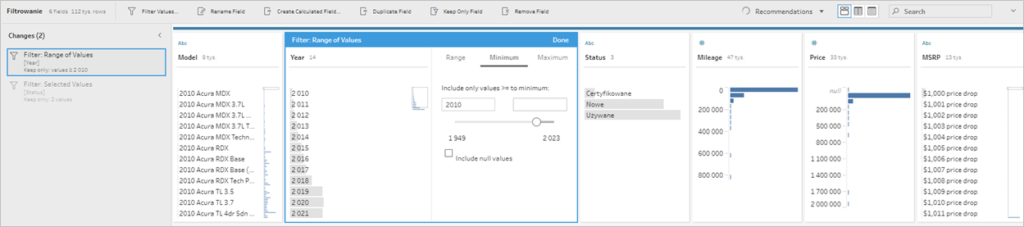
4 – This option depends on the type of data: for example, for text data you can use Wildcard March, where you can filter the text depending on whether it contains a specific character string or starts or ends with it. The Range of Values can be applied to numerical values.
Going back to our data – let’s perform the following filtering: year above 2010 and status only Used or Certified. A year is a numeral value, so you can select the Range of Values, then option Minimum (you want cars min. from 2010):
Your filtering will appear in the change pane on the left. Next, you can perform filtering in the Status field, where you select only Used and Certified – filtering can also appear in the Changes list:
The data filtered in this way can be further processed.
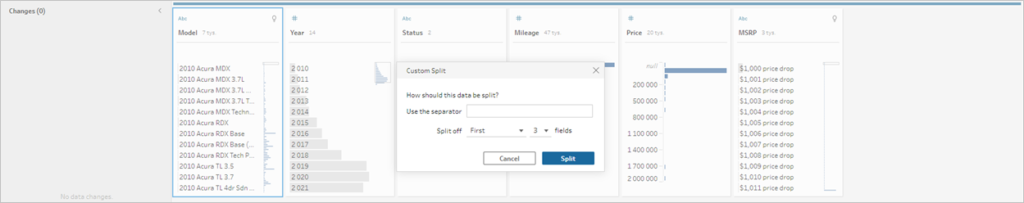
Split – getting information from the existing field
Another transformation that you can access from the level of the field options is Split. In this example, we will split the Model field in order to separate the year, make and model. After clicking the field options, select Split, where you can choose from the following:
1 – Automatic Split, which allows Prep to identify the key, according to which splitting will be performed
2 – Custom Split, where the user can define the split criteria
Automatic Split will work in simple cases, but it’s good to know Custom Split, to be able to control how the data is split. By selecting the Custom option, you can define the separator (space in our case) and the number of fields to be returned (e.g., first, last, all). Because the descriptions of cars are rather long and complex, let’s separate the first three elements: the year, the make and the model:
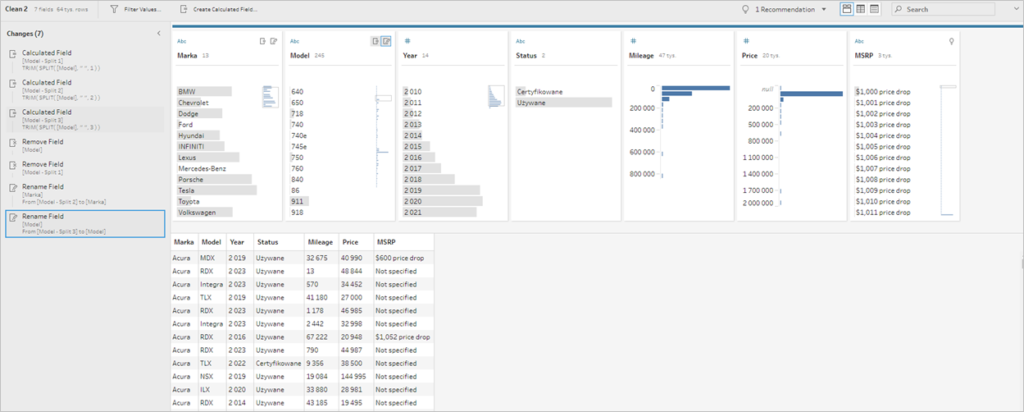
We already have the year in the data, but at this point, we are unable to extract the central elements – so we will remove the duplicated year later. We will neither need the source field of the Model at this stage – we discard it by choosing Remove from the field option. The last step is to change the names of the newly created fields. All changes are shown in the Changes pane:
Creating calculated fields
So far, we have used transformations from the field options, which has made it easier to transform the data by using the graphical interface. In addition, you can also create your own calculations, by using a variety of available functions:
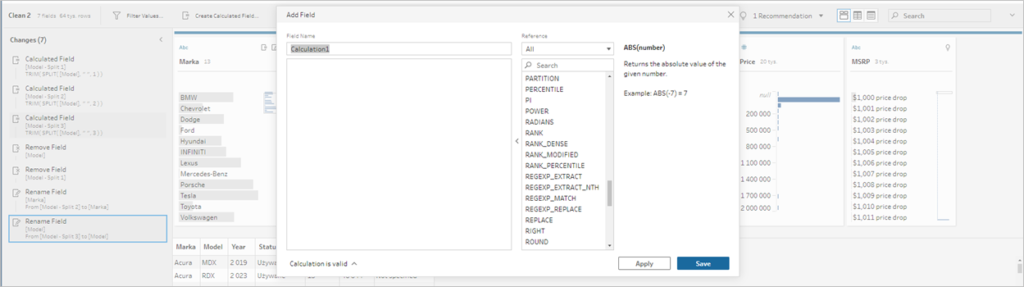
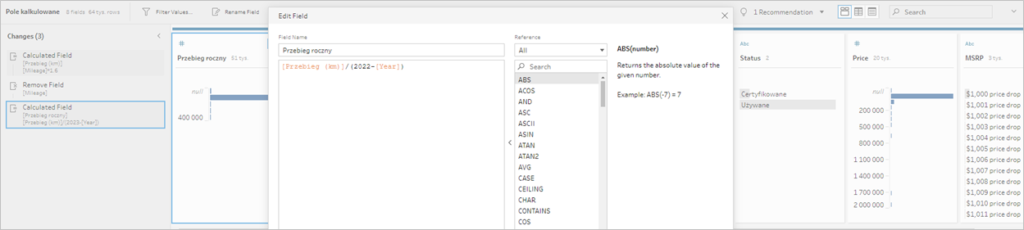
Calculations are created in the same way as in Tableau. You can use this option to transform the Mileage field (expressed in miles) into kilometres:
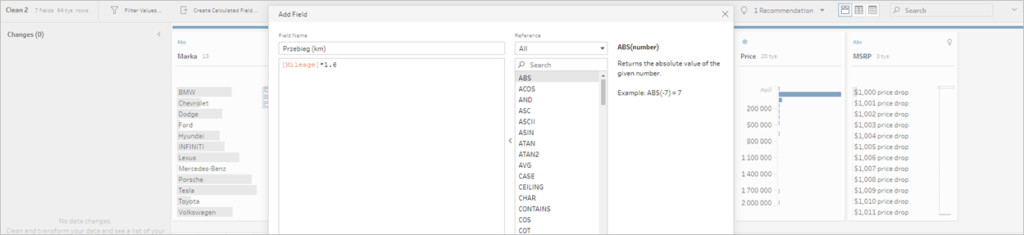
Since mileage depends to a large extent on the car’s age, add the field Annual Mileage. In order to do this, you must first calculate the car age in years, and then divide the mileage by years:
Of course, you can create these calculations in Tableau at a later stage. However, if you are working with a single row (and not with aggregated data), it’s worth doing these transformations at the stage of preparing the data – it will be easier to use them in Tableau at a later point.
So far we have discussed
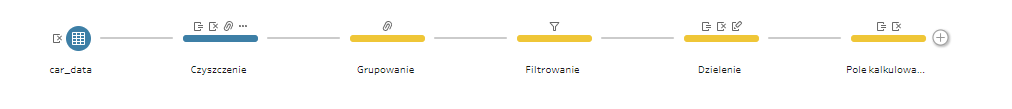
In conclusion, in the previous post we discussed how to connect and clean the data, and in this entry we have reviewed grouping, filtering, splitting, and creating calculated fields. All these transformations are performed in the Clean Step, but you can break them down into separate steps. By adding colours and names, you will get an excellent overview of your data flow:
In the next entry of this series, we will look at aggregating and pivoting the data, connecting various sources (join and union), and exporting data for further visual analysis in Tableau.
Mateusz Karmalski, Tableau Author


