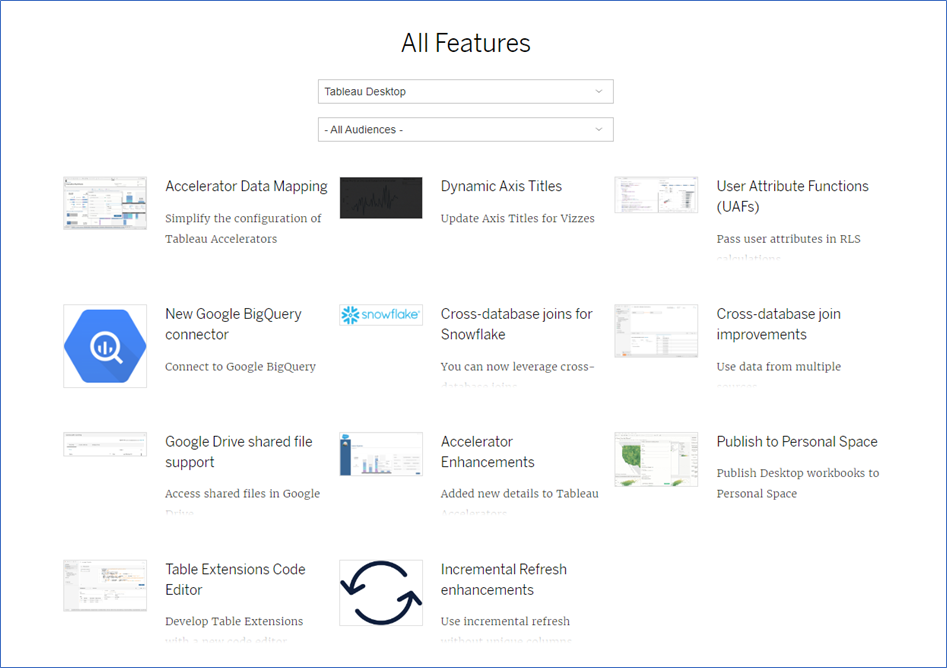
Tableau regularly updates various functions and features. Sometimes it releases new functionalities that change the way of working with Tableau (for example, a new data model based on relationships), on other occasions it introduces new features that make the work easier (such as dynamic zoom visibilities). At times it implements apparently invisible changes that improve certain tools. Thus, not everything is a game changer, but usually all modifications are more or less significant. In addition, updates are also released for Tableau Sever, but they are less frequent than for Desktop. The newest version, Tableau 2023.1 includes 42 changes to the entire system, and 11 of them are for Tableau Desktop:
Accelerator with Data Mapping
Tableau Accelerators is a set of pre-built dashboards designed for data analysis. Accelerators can be downloaded from the Table Exchange website in the form of Tableau workbooks. Various types of dashboards are available – from financial (Income Statement, Accounts Payable or Balance Sheet), sales (Sales vs Quota, Sales and Margin, Sales Pipeline) to e-commerce (Google ads, Google Analytics). Some tools are designed for specific industries or departments, for example Service Desk or Telco Calls. Although accelerators are not new, the way in which you can swap sample data out for your data has changed. Until now, it was a manual process – we had to replace data sources, and in the case of other names of fields – we had to change the reference lines. In the upgraded version, Tableau has launched Data Mapper, a new functionality that allows to swap the fields out for your data through the interface. How to do that step by step:
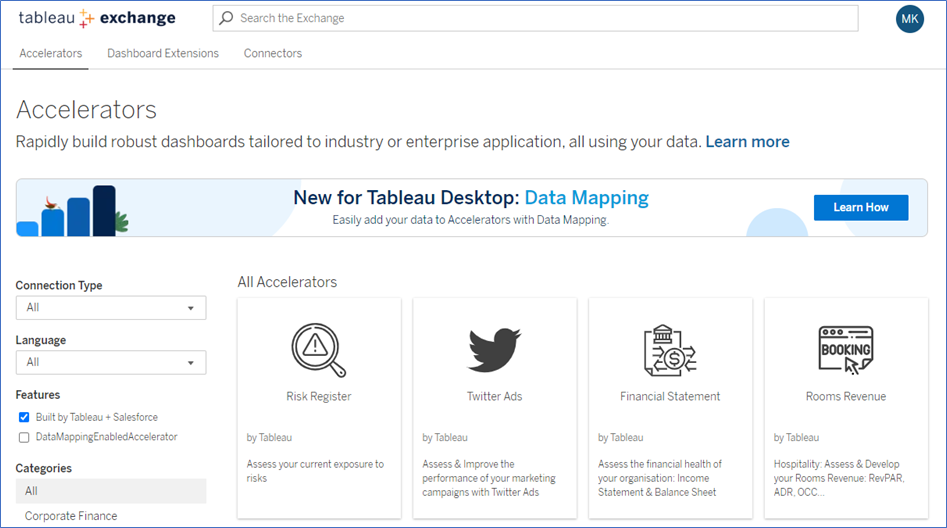
1 – On the Tableau Exchange website, go to the Accelerators tab and select your preferred dashboard:
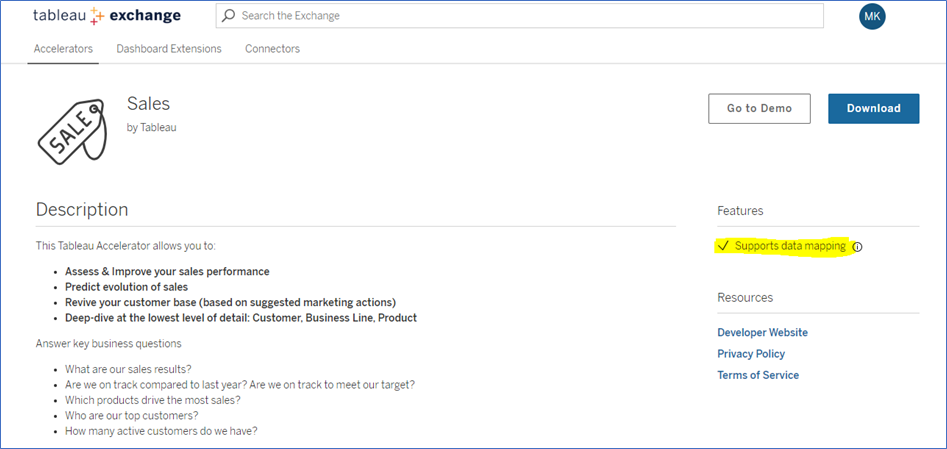
2 – After choosing the accelerator you want to use, a window with details will open, with the information about supporting data mapping:
3 – Download the dashboard and open it, and a Data Mapper window will appear:
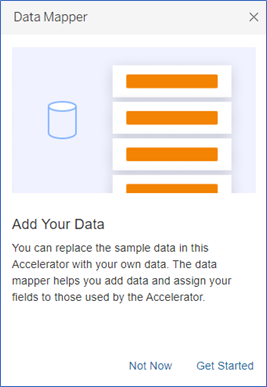
4 – Select Get Started and you will see a prompt to indicate your source of data, once you do that, a prompt to map the fields will appear:
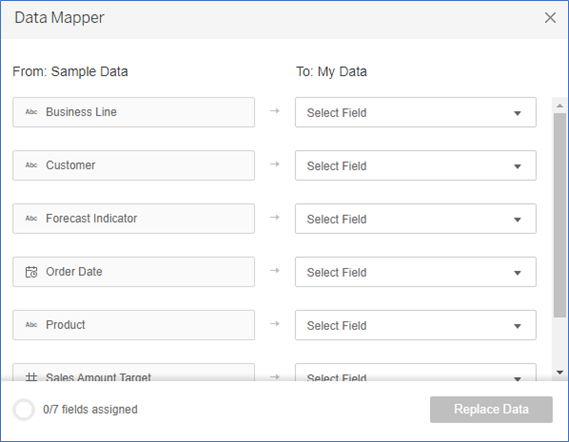
5 – The final step is to select Replace Data and you will get a ready-to-use dashboard with your data.
Dynamic Axis Titles in Tableau version 2023.1
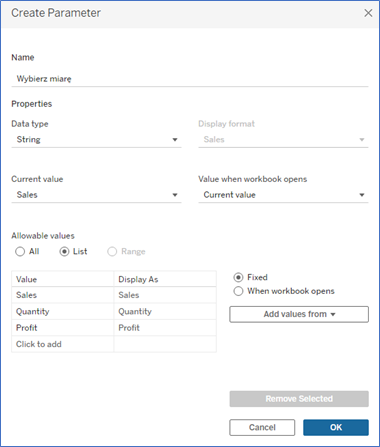
Dynamic Axis Titles is a function that users have looking forward for ages. Even though it may sound like a seemingly minor feature, it can be very useful when you work with variable measures in your charts. To illustrate this, we will take a look at what it used to be like. Let’s assume you want to work with one chart to visualize various measures which can be selected using parameters. In the first step, you will create a parameter with three measures: Sales, Quantity and Profit.
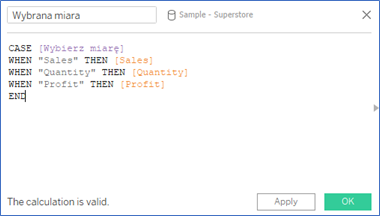
Then you need to create the “Selected Measure” calculation field which returns the value depending on the choice made in the parameter:
Next, create a simple line chart to demonstrate the change of the selected measure over time:
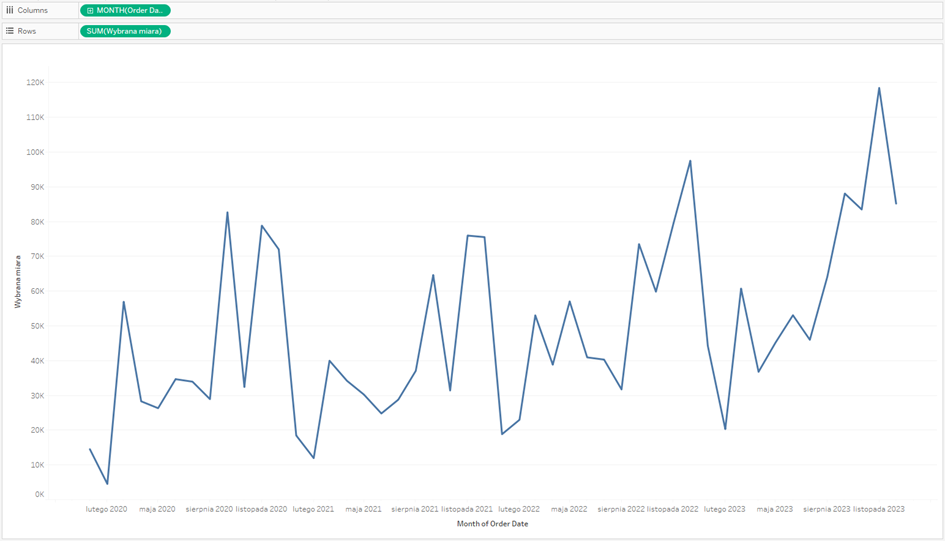
Pay attention to the title of the vertical axis – it’s the name of the measure, in this case “Selected Measure”, which doesn’t tell us what that measure is. Until now, you would change the name manually, but this name would no longer be up-to-date after changing the measure in the parameter. This is where the new, long-awaited functionality comes in – Dynamic Axis Titles. Go to Edit Axis, in the section Axis Titles select a field value (if it’s clear and constant) or a parameter value. Select the previously created parameter „Select Measure” to get a variable axis title.
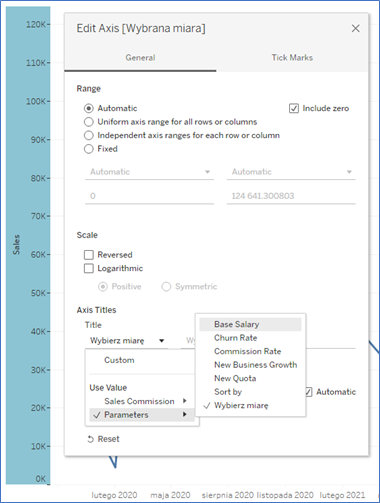
This feature cannot be a game changer, but it will simplify the preparation of the chart with variable measures. It allows to clearly indicate what is shown on the chart, making the dashboard more accessible and transparent. Furthermore, developers no longer need to use the alternative ways to solve this issue, which will make their work much easier.
User Attribute Functions (UAFs)
User Functions have been available in Tableau for some time, and they are designed to display various user attributes. The functions have their own group (User) and allow, for example, to display the username:

Standard user functions refer to your own Tableau account – a username or a domain used for logging in is returned. New functions – USERATTRIBUTE and USERATTRIBUTEINCLUDES are designed for connected apps. Let’s imagine a scenario, in which your dashboard is supported by a web portal, where you use a connected app to log in – this is often used in the context of embedded analytics. A user, who logs into the application/portal has certain attributes, which can be accessed through these functions:

With these attributes, you can determine the type of information displayed in your dashboard depending on the users, and assign them to a group or hierarchy in the connected app.
Other new features in Tableau version 2023.1
Although all other functions don’t introduce any key or visible changes, it’s good to know what Tableau has implemented and improved:
1 – New Google BigQuery connector (increased efficiency, cross-join support)
2 – Cross-database joins support for Snowflake
3 – Optimization of cross-database joins for databases
4 – Access to Google Drive shared files through a connector
5 – Improvement of accelerators (KPI definitions, descriptions of calculations, documentation)
6 – Tableau Extensions Code Editor (IDE)
7 – Optimized incremental refresh of data extracts (improved performance)
8 – Publishing workbooks for private space in Tableau Server
Mateusz Karmalski Tableau Author
