The new Gartner Report, or the continuation of the Oscar duel between David and Goliath
The next edition of Gartner’s “Magic Quadrant” for Business Intelligence solutions has been released. With little change from last year, Gartner still maintains that there are three leaders in the Business Intelligence solutions market – Microsoft, Tableau and Qlik. Except that, according to Gartner, Microsoft is leading slightly “more” this year than a year ago. Most of the report’s readers will come to such conclusions “at first glance”.
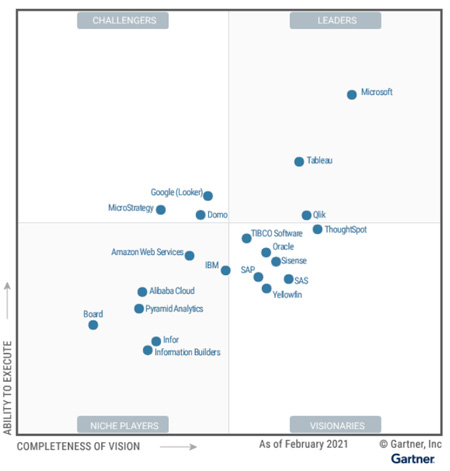
There are, however, a few “buts”:
1. Remember that Gartner does not evaluate TOOLS, but SUPPLIERS. It’s a bit like the Oscars would not go to movies and their creators, but to movie studios. It changes your perspective a lot. Since the two evaluation criteria in the “magic square” are “Completeness of vision” and “Ability to execute”, it is obvious that Microsoft – one of the largest corporations in the world, having in its portfolio a multitude of IT tools, having its own “ecosystem”, from Windows, through Office, MS SQL Server, a web browser, the Power Bi tool, to … Xbox (and on top of that huge financial resources, a huge network of Partners, etc.) – will get very high marks in such a ranking.
2. From this point of view, we are comparing David with Goliath – a company specializing in Business Intelligence solutions, for which it is the basis and sense of existence (Tableau) with a larger corporation, for which Business Intelligence is just one of many markets on which it operates, a bit of a “check – box” in its offer.
3. Choosing between these vendors, therefore, means choosing between a standalone, comprehensive and mature BI platform that can be managed in any way (on premise, any cloud, private cloud) such as Tableau, and a developing component of a large “ecosystem” that only works within that ecosystem, which is Power BI. In the reality of a large company, the decision to use Power Bi is in fact a decision to enter the entire Microsoft “cloud” infrastructure – as we observe with our customers, a decision not always taken fully consciously. 3. In other words, to paraphrase a slogan from one of the forgotten advertising campaigns – Tableau can confidently say “we try harder”.
4. What is interesting about the report is its characterization of individual providers, which 99% of its readers do not read. I will quote the Microsoft and Tableau descriptions in full.
Microsoft
Microsoft is a Leader in this Magic Quadrant. It has massive market reach through Microsoft Office and a comprehensive and visionary product roadmap.
Microsoft offers data preparation, visual-based data discovery, interactive dashboards and augmented analytics in Power BI. This is available as a SaaS option running in the Azure cloud or as an on-premises option in Power BI Report Server. Power BI Desktop can be used as a stand-alone, free personal analysis tool. Installation of Power BI Desktop is required when power users are authoring complex data mashups involving on-premises data sources. Microsoft releases a weekly update to its cloud-based Power BI service, which gained hundreds of features in 2020. Notable additions include more augmented analytics in the form of AI-infused experiences, including smart narratives (NLG) and anomaly detection capabilities for out-of-the-box visuals. Strengths
• Alignment with Office 365 and Teams: The inclusion of Power BI in the Office 365 E5 SKU has provided an enormous channel for the platform’s spread, making it “self-seeding” in many organizations. The increasing integration of Power BI into Microsoft Teams, with its tens of millions of daily active users, will further increase Power BI’s reach in the world of remote working. Power BI is now often the option that organizations have in mind when using Gartner’s client inquiry service to ask about ABI platform selection — “why not Power BI?” is effectively the question most are asking.
• Price/power combination: The influence of Power BI has drastically reduced the price of tools in the ABI platform market since its launch. In this case, though, low price does not equate to limited functionality. The Power BI cloud service is extremely rich in its capabilities, which include an enlarged set of augmented analytics and automated ML capabilities. AI-powered services, such as text, sentiment and image analytics, are available within Power BI Premium and draw on Azure capabilities.
• Scope of product ambition: Microsoft continues to invest in a broad set of visionary capabilities and to integrate them with Power BI. It now claims to have 80,000 customers using AI services in Power BI deployments. It continues to encourage usage at scale by, for example, applying ML-driven automatic optimization of materialized views on Azure Synapse (and soon other data sources, including Snowflake and Redshift) to autotune query performance.
Cautions
• Functional gaps in on-premises version: Compared with the Power BI cloud service, Microsoft’s on-premises offering has significant functional gaps, including in relation to dashboards, streaming analytics, prebuilt content, natural language question and answer, augmentation (what Microsoft calls Quick Insights) and alerting. None of these functions are supported in Power BI Report Server, its on-premises offering.
• Azure only: Microsoft does not give customers the flexibility to choose a cloud IaaS offering. Its Power BI service runs only in Azure. However, customers that utilize Azure can take advantage of the global reach offered by Microsoft’s cloud platform. Power BI Premium enables customers to enable multigeography capabilities in their Power BI tenant, and they can deploy their capacity to one of 42 globally available data centers.
• Content promotion and publication process: The way in which Power BI handles the promotion and publication of content can lead to a significant administrative overhead for customers. The fact that there is a one-to-one relationship between published Power BI apps and Workspaces (Power BI’s collaborative “development” environment) means that organizations may face a situation in which they are manually managing many hundreds of Workspaces. Retroactively fixing this issue is a complex task. How to govern self-service usage is perhaps the most common question asked about Power BI by users of Gartner’s inquiry service. The Power BI team is, however, investing in governance capabilities to help customers manage their Power BI environments better.
Tableau
Tableau is a Leader in this Magic Quadrant. It offers a visual-based exploration experience that enables business users to access, prepare, analyze and present findings in their data. It has powerful marketing and expanded enterprise product capabilities, but the integration of Salesforce Einstein Analytics, now renamed Tableau CRM, remains a work in progress.
In 2020, Tableau enhanced its data preparation and data management capabilities. For data preparation, it released enhanced data modeling capabilities, which make it easier to analyze data across multiple tables at different levels of detail by building relationships between tables with a simple in-browser visual experience. For data management, Tableau Prep Conductor and Tableau Catalog offer a cohesive experience for operating and automating data management and understanding data lineage. An Einstein Discovery dashboard extension, the first integrated product to bring the predictive modeling capabilities of Salesforce Einstein Analytics to the Tableau platform, is scheduled for release in March 2021.
Strengths
• Analytics user experience: Although Tableau keeps adding new capabilities, it always maintains a sleek experience for users, so they can perform analysis seamlessly. Although visual-based exploration is highly commoditized in today’s market, Tableau can still differentiate itself by offering an intuitive analytics experience with richer capabilities based on its patented VizQL engine.
• Customer enthusiasm: Many customers demonstrate a fanlike attitude toward Tableau, as evidenced by the more than 145,000 people who attended its 2020 online user conference. Tableau Public, a free platform on which to publicly share and explore data visualizations online, has over 3 million interactive visualizations. A user-experience-focused design means that, particularly for users in analyst roles, Tableau’s offering is compelling and even enjoyable to use.
• Salesforce opportunity: The Tableau Viz Lightning web component offers a low-code experience to simplify the task of integrating Tableau visualizations into Salesforce. Work.com, Salesforce’s cloud offering to help organizations reopen workplaces safely and efficiently, uses the Tableau Viz Lightning web component to add a global COVID-19 tracker dashboard to the Workplace Command Center. The deeper integration of the MuleSoft data connector capabilities and a newly acquired Slack collaboration tool means that Salesforce clients have a strengthening set of reasons to consider Tableau.
Cautions
• Not cloud-native: Tableau offers cloud-hosted solutions (Tableau Online and Tableau CRM), but the company’s heritage is in on-premises deployments, for which it has a massive installed base. Tableau does not have a cloud-native architecture for on-premises customers to embrace the cloud’s full benefits. Deployment of Tableau Server in a containerized infrastructure is not currently supported (but is planned for 2021). As such, beyond Tableau Online, it cannot utilize the cloud’s elasticity to automatically scale out in order to handle dynamic workloads.
• Premium pricing: Tableau’s pricing is an issue raised by users of Gartner’s client inquiry service. Compared with some of the cloud vendors in this market, Tableau is expensive. The addition of Tableau CRM for a list price of up to $150 per user per month may well increase the concern of customers who are considering scaling their deployments or acquiring new functions.
• Integration challenges: As is to be expected, the integration of Salesforce’s ABI capabilities with those of Tableau is taking time. Currently, users face a fragmented experience if they want to take advantage of the augmented analytics functions of the former Einstein Analytics while using the Tableau platform. Einstein Analytics’ strengths in automated data stories, key driver analysis, custom automation and explainable AI are not yet integrated into the Tableau user experience.
To sum up – looking from the perspective of not Vendors, but Tools – we are comparing the offer of the developing, but still more modest functional component of a large and complex, cloud “ecosystem”, which is MS Power BI with beloved by Users, efficient, mature and easy-to-use tool, which is Tableau. The costs of both tools are comparable. The choice – as always – is yours.
Read more about both tools at https://comparebitools.com/ .
The text expresses the author’s personal views.
Witold Kilijański
CEO
NDLS sp. z o.o.


