Analysis
Business Intelligence
Get a complete picture of your company’s data, use the information you collect. Analyse key business indicators in a convenient and easy-to-read format. Track your progress in acquiring new clients from any device and location.
Create visual analyses of your data and add them as a permanent part of your CRM.
Learn more >

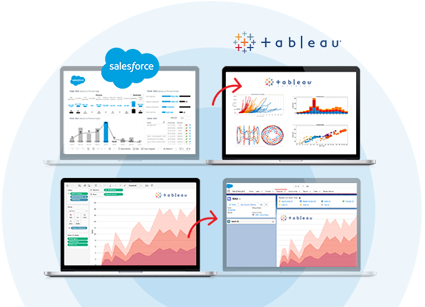
Tableau dashboards in your CRM

Up-to-date
in Tableau, you create a report once and the data updates automatically according to your needs

Mobile
reports can be accessed from any device you use

In an accessible form
Tableau reports are embedded in your CRM
You can find all the most important data
from the entire company in one report in your CRM
Let us help you make reports in Tableau!
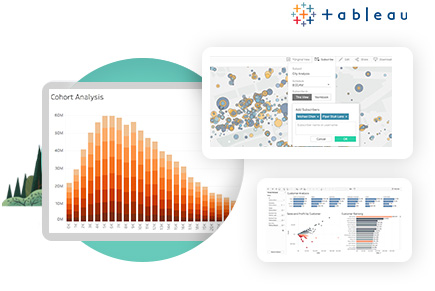
Reports in Tableau:
 they can take any form and analyze any data
you can overlay Salesforce data with data from other sources
data can be integrated both ways – i.e. reports from Tableau can be embedded in Salesforce and reports from Salesforce can be embedded in Tableau
Check >
Reports in Tableau:
Check >
Sales reports
Sales funnel shown quantitatively and in value based on the sales opportunities generated, e.g. at what stage in the sales process they are, what their value is, how many open and how many closed opportunities there are. Reasons for lost opportunities.
Sales conversion – the number of sales opportunities that were won, what their value was, how long the sales process took.
Counterparty ranking – reporting on sales by companies that generate the highest and lowest profits.
Product ranking – an analysis of the sales of specific products or services that a company offers.
Sales dynamics – a report performed on the basis of the offers issued at a given time. Employee activity and event lists – sales results of individual salespeople together with the number of events, i.e. notes made, phone calls, meetings.
… and all other reports you can dream up in Tableau!
Marketing analysis
Marketing is the industry where most of the changes take place, so accurate and ongoing analysis is required. Continuous monitoring of the effectiveness of the measures makes it possible to implement the suggestions generated as conclusions from the analysis. This allows for long-lasting results that can bring incredible success to the brand.

Create effective marketing analyses such as:
Effectiveness by determining the number of new leads generated in a given period
Based on the leads that went into the sales process in terms of their quantity as well as their quality
Sources of Lead acquisition – with this we can indicate from which source the most leads come, whether it is Social Media, telemarketing, Paid or Free Campaigns, email marketing, etc.
Campaigns run – checking which campaign performed best and how many Leads they generated. … and all the other analyses you can dream up with Tableau!
Check >
Check >
CRM is an information and analysis centre for all employees
The Business Intelligence analysis of the current situation of the company and the processes taking place allows:


