Calendars in Power BI. There are many functions that help quickly perform time-related calculations. The “Time” dimension appears in every report; therefore it is vital to know how to use these functions.
What can you use a calendar in Microsoft Power BI for?
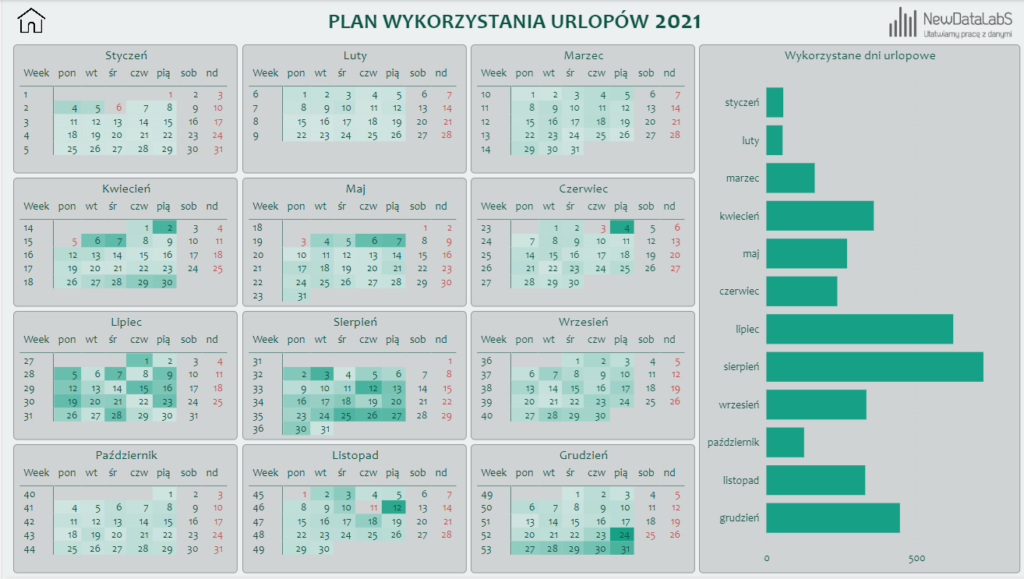
For example, if you add to your calendar the data of your employees’ annual leaves, you will be able to generate a report on the leaves taken.

Why to create a separate calendar if your source table contains the date column?
In order to answer this question, you need to understand the calculation methodology for the formulas that allow you to show the year-over-year change. When comparing the annual leave data from Sundays of one year to the corresponding days in the following year, there will be no data in the source table. In this case, you will compare your data with the non-existent dates and will not see the year-over-year changes, which in turn will spoil the calculation of indicators. If you create a calendar, it will allow you to fill in all “gaps” in the time frame specified. The second reason for creating a calendar is the efficiency. By adding new columns to present e.g., a week number to the table with several million records, you would overload it with the data. Whereas, adding this column to the dictionary table is much more effective and easier to manage.
Why to create calendars in Power BI?
The answer should be to optimize the efficiency of your reports and to secure the correctness of the indicator calculations.
To allow the reports to perform their work, you need to include a calendar or a table with the dates in your data model. Power BI has the functionality of a built-in hierarchy of dates created based on the fields with time dimensions, which provides a simple classification of dates, including year, quarter, month and day. Such a hierarchy makes it much easier to work with the data, however, it has certain limitations. It will not allow you to break down your data into weeks, days of the week or to see what your data would look like in the year different from your standard financial year. For this reason, it is good to prepare your own calendar before you start working on a report.
Power Query or DAX to create calendars in Power BI
In Power BI there are two options to create your own calendar. You can use the Power Query or write it in DAX. Both these methods are very similar in terms of their effectiveness and applications. Nonetheless, today I am going to explain how to create a clear and functional calendar, which can be used in all reports. For example, for this purpose you can write your calendar in DAX.
In order to create a Calendar in DAX, Power BI provides two very straightforward functions:
- CALENDARAUTO
- CALENDAR
Both these functions will return the column „Date” with a list of unique date values. The question may arise as to how these two functions differ.
Calendarauto or Calendar functions in Power BI
The CALENDARAUTO function will automatically search the whole data model to find the first date and the last date, and to create a calendar on their basis. However, it is not ideal, as when you have a wrong date in your data or a column with the dates of birth. As a result, you will generate a calendar with the dates from 1990 onwards.
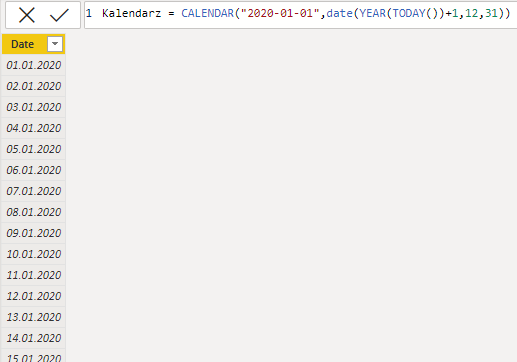
On the other hand, the CALENDAR allows to specify the desired range of time. You can do that by starting with the oldest date available in your dataset (you need to enter it or calculate it from the specific table and column) and ending with another year counted from today’s date. The resulting function will return a column with dates, for example 2020.01.01 to 2023.12.31.

Once you have the range of dates defined, you can prepare the whole calendar with all the data required. Using the DAX functions, you can expand your calendar by adding more columns.
At this point, it is worthwhile to consider what you need in order to expand your formula with additional columns, using the relevant functions in order to display the information about the year, quarter, month, week number, day or day of the week and various combinations of the aforementioned examples in one column (for example a year combined with the abbreviated name of the month).
Creating tables with real dates in Power BI
By creating appropriate functions, you can, for example, define your own financial year. The section shown above is just a starting point for creating a real date table. How complex it is going to be and what it is going to include depends on the requirements for the reports you are working on. What is certain, however, is that it offers you great capabilities. Below you can see a sample calendar with a range of automatically generated columns, without needing to use the “Add column” option and copy the same formulas in the reports that follow.

To make your calendar more functional, transparent, and automatic above all, you can write some of your arguments using variables. This will allow you to develop the internal definitions of the terms used later in the calculations that form further columns in the calendar. As a result, you will have better control over your data, and you will be able to adapt the data quickly and easily to your requirements. If you want others to use this calendar, it is also good to add comments with descriptions and guidelines.

This will make navigating through your table much easier both for you and for the users, who will be working on it for the first time. It is also important to configure all text fields, such as the “Name of month”, so that it is specified what column they will be sorted by. If you don’t do that, month names will be sorted alphabetically.
The advantages of creating customized date tables
There are many advantages of creating your own date table. It will allow you to filter the reports according to the basic time attributes and all other aggregations required by the report. You can create a view of time, which is different from the standard calendar, and is tailored to your expectations. You just need to create a good calendar once, to be able to use it in all your reports. The additional fact tables which are available in your data usually don’t contain separate rows for every day, unlike your customized calendar.
Certainly, every user of Power Bi who prepares reports, will have to create a customized calendar sooner or later, which then can be used on a daily basis. The time is one of the key dimensions in reporting, and designing your own calendar will allow you to save time when creating reports. Moreover, it improves the effectiveness and consistency of the data.
Joanna Korbecka
