LOD (Level Of Details) calculations, already introduced in Tableau 9.0, have introduced a small revolution in the flexibility of Tableau calculations. Why are they unique? Simply put, LOD calculations ... Read more >
Microsoft Power BI, more than a chart
Visual data analysis, is much more than a simple chart. Preparing a report in the right tool is an image, a graphic communication, conveying the most important information about the data to the ... Read more >
Heat Map – what exactly is it?
When I conduct training, I always try to ask participants what their imagination tells them when I say heat maps. I usually hear about a map with shades of brown, red, orange and yellow. Only in ... Read more >
Scatterplot – secrets
Scatterplot is a very simple graph. In fact, two measures will suffice. In doing so, however, it focuses Tableau's logic for creating visualizations as if through a lens. Here we can see the principle ... Read more >
A comparison of ETL add-ons to self-service BI: Tableau and PowerBI
In a previous post, I discussed the concept of ETL (Extract, Transform, Load) tools along with a description of the Tableau Prep application. Continuing the topic, in the following post I will ... Read more >
A comparison of ETL add-ons to self-service BI: Tableau and PowerBI
By definition, self-service BI tools should provide the user with the ability to work with data independently. This means not only the analytical and visual-presentation layer, but also modeling the ... Read more >
URL actions in Tableau-what are they?
URL actions are one of six actions available for selection in Tableau. This is a hyperlink that allows you to use this type of action in many ways. The primary use is to navigate to a web page in a ... Read more >
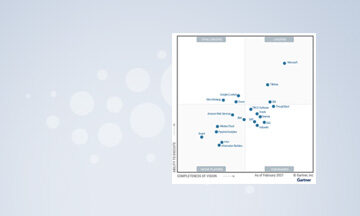
The new Gartner Report, or the continuation of the Oscar duel between David and Goliath
The new Gartner Report, or the continuation of the Oscar duel between David and Goliath The next edition of Gartner’s “Magic Quadrant” for Business Intelligence solutions has been released. With ... Read more >
LOD calculations also in Tableau Prep
The ability to use LOD (Level of Detail Calculations) in Tableau Prep is one of the most anticipated innovations in this tool. Until now, they required some skill and cleverness. Now, from version ... Read more >
Heat Map in Tableau
The appearance of the Heat Map in Tableau has generated general enthusiasm. No wonder. Excellent visual effect guaranteed! And yet it turns out that this is not a simple type of visualization. Today ... Read more >
- « Previous Page
- 1
- …
- 4
- 5
- 6
- 7
- Next Page »


