In the previous posts of the “60 Charts in Tableau”, I described the techniques that help visualize the category and time data. Let’s recall: – bar charts were recommended for category data, and line charts for time data. What to do in the case when you need to visualize the data that is part of a whole? The answer is – it depends – and I will try to explain it in the below post.
A pie chart and its bad reputation
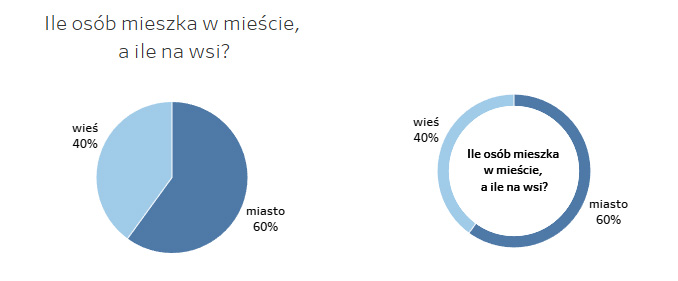
A pie chart is one of the most condemned techniques for visualizing parts of the whole by the specialists. Why? First of all, it’s illegible when you have more categories. Moreover, it’s hard for human beings to compare angles, and pie charts cannot be used to compare changes over time. Despite this, pie charts are quite popular, as it is easy to image the whole as a complete circle and its sections as the data under analysis. However, the limitations of these charts usually surpass the advantages, and for this reason the professionals hardly ever use them. They are much more popular among the unexperienced users. A pie chart may be useful, but you need to bear in mind certain basic principles:
- You visualize just a few data categories which sum up to 100% (ideally two, maximum three categories)
- Sort the categories by value (clockwise)
- You don’t want to show changes over time
If you follow the above principles – a pie chart will be ok, but a donut chart would be a better choice. This chart allows you to use the space inside the circle for a title:
If not a pie chart, then…
If you need to visualize more than two categories, you’d better go for other types of charts. The simplest alternative would be a stacked bar chart (or a stacked column chart):

This chart is much easier to interpret than the pie chart and takes much less space. If your focus is to compare the values – it would be good to convert the chart into a bar chart and add the option of summing up to 100%:
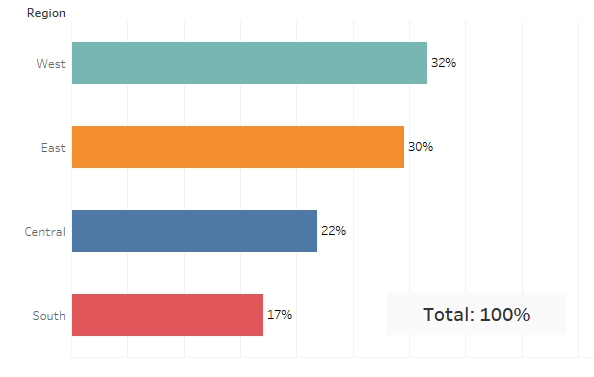
This chart takes more space, but it makes the analysis and comparing the values much easier. Another option would be a tree map, which has become quite popular in the recent years. In principle, this chart is similar to a pie-chart, where instead of slices, rectangles are used:
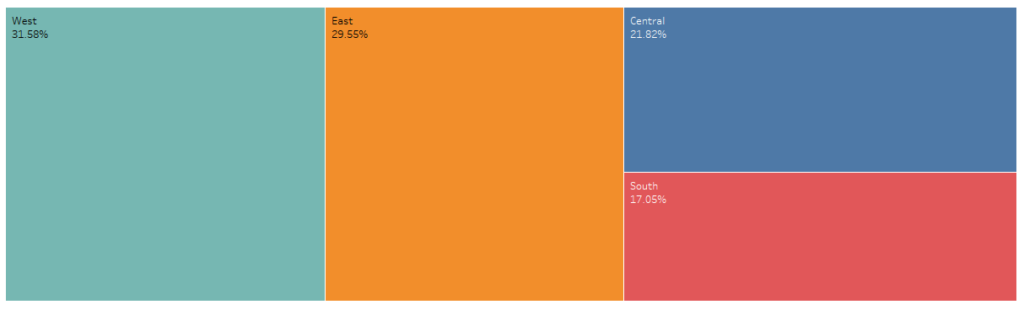
This graph is challenging, as human beings struggle to compare areas. Still, they are easier to compare than the angles. Thus, when combined with labels, a tree map could be an interesting alternative.
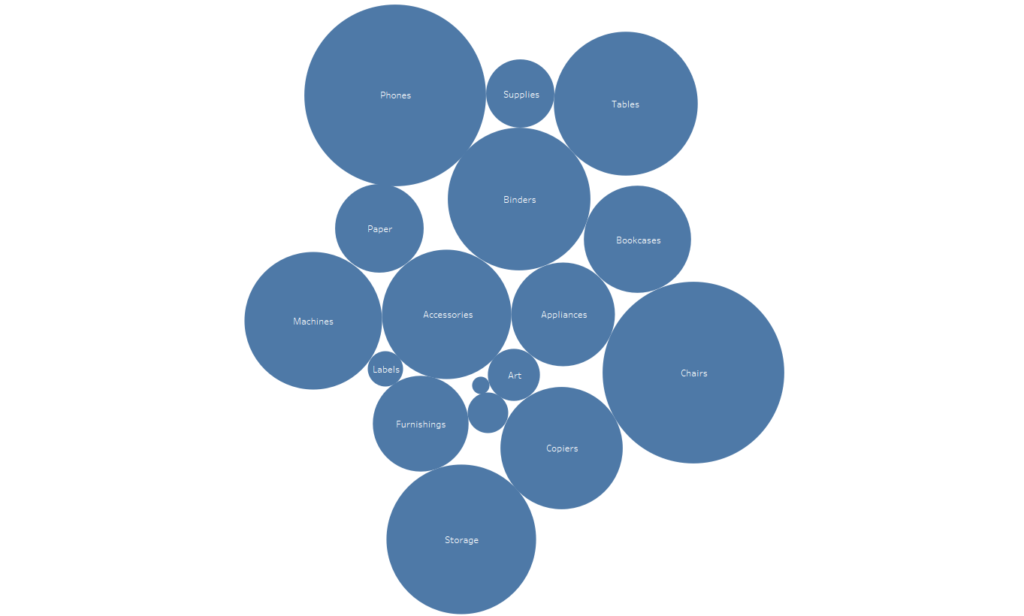
The worst idea is to use packed bubbles, as comparing the sizes of circles might be very problematic in contrast to analyzing rectangles. For this reason, you should always avoid using these charts.
More categories – more options
If you need to compare the share of various categories for more than one dimension, you can use a stacked bar chart or a column bar chart. These charts use the well known and easy to interpret bars for comparing values:
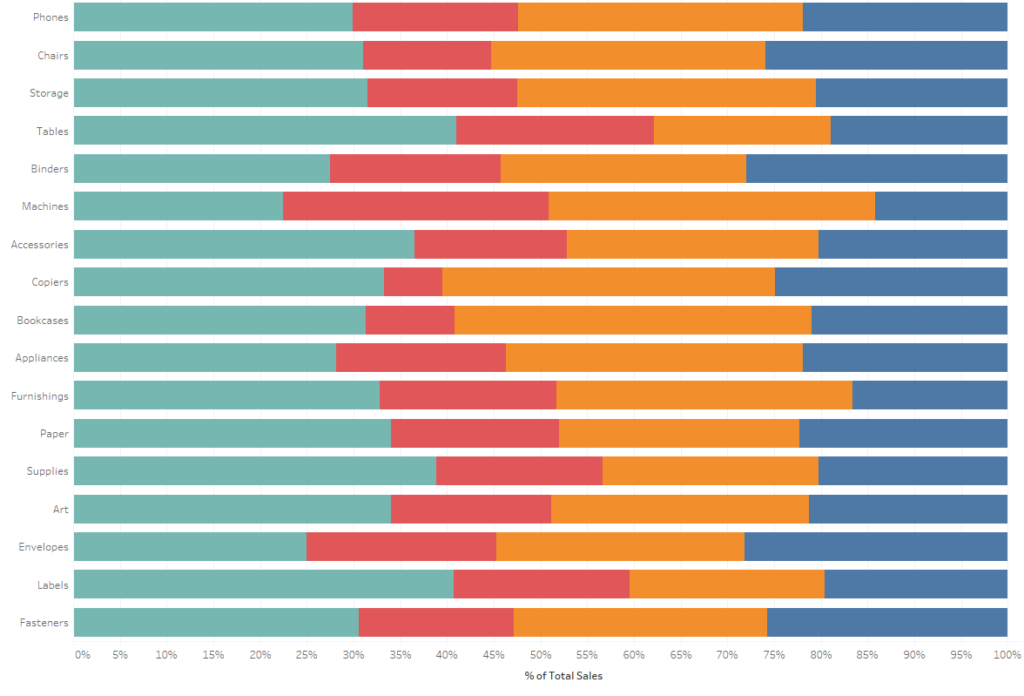
You should bear in mind, that it’s better to use stacked bar charts to visualize the category data than the stack column chars – similarly as in the case of the usual bar charts. A stacked column chart will be a better choice when visualizing changes in the share over time:
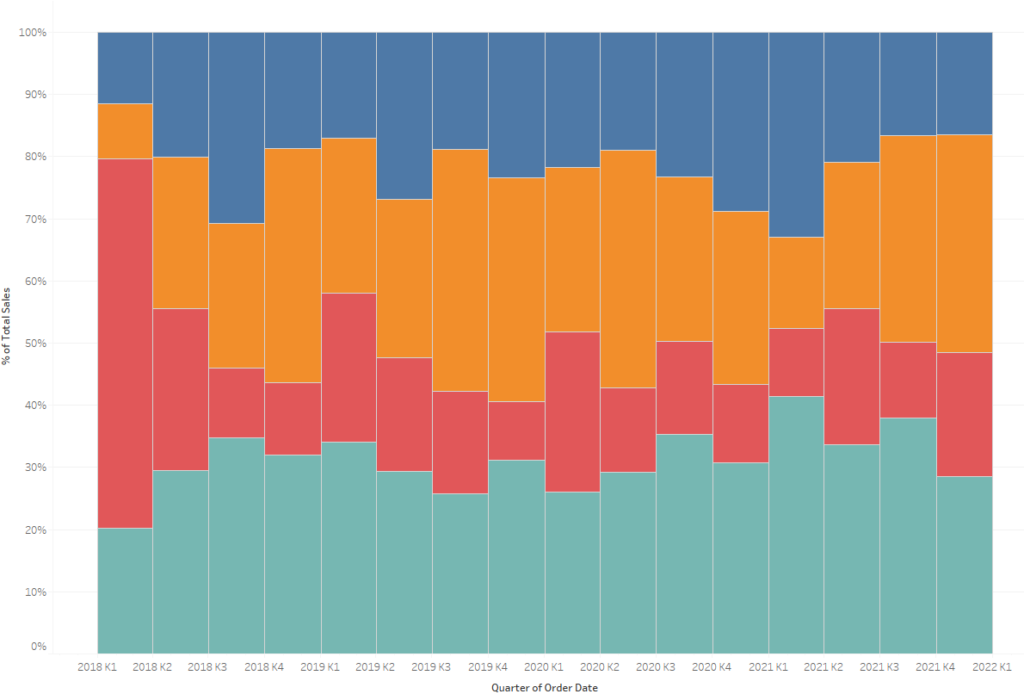
However, bar charts are more often associated with category data, therefore a stacked area chart could be a good alternative to visualize changes over time:
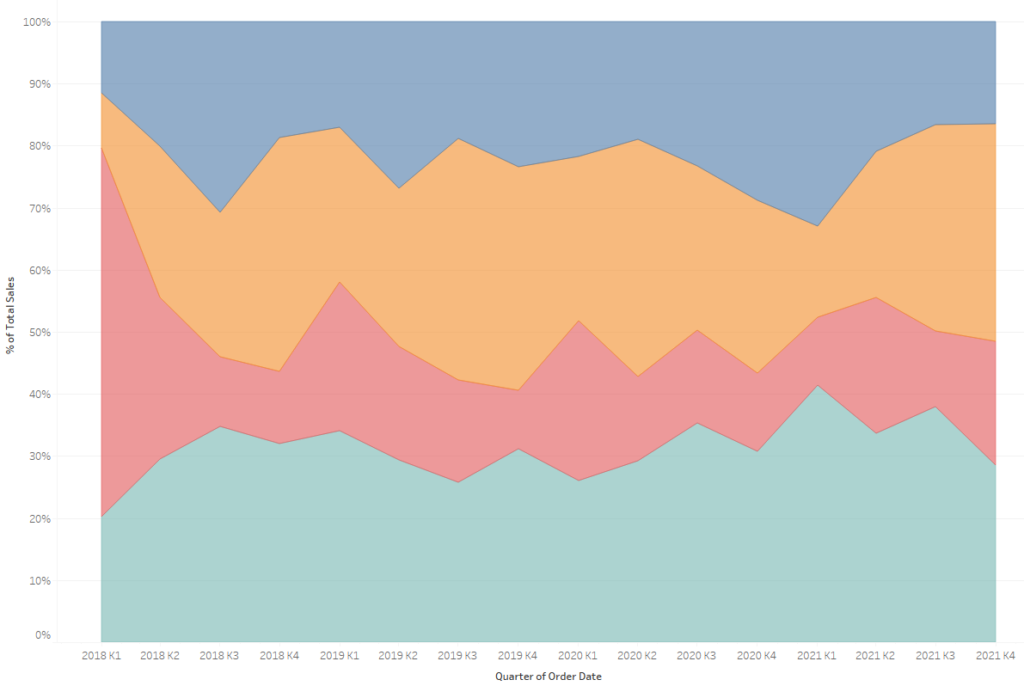
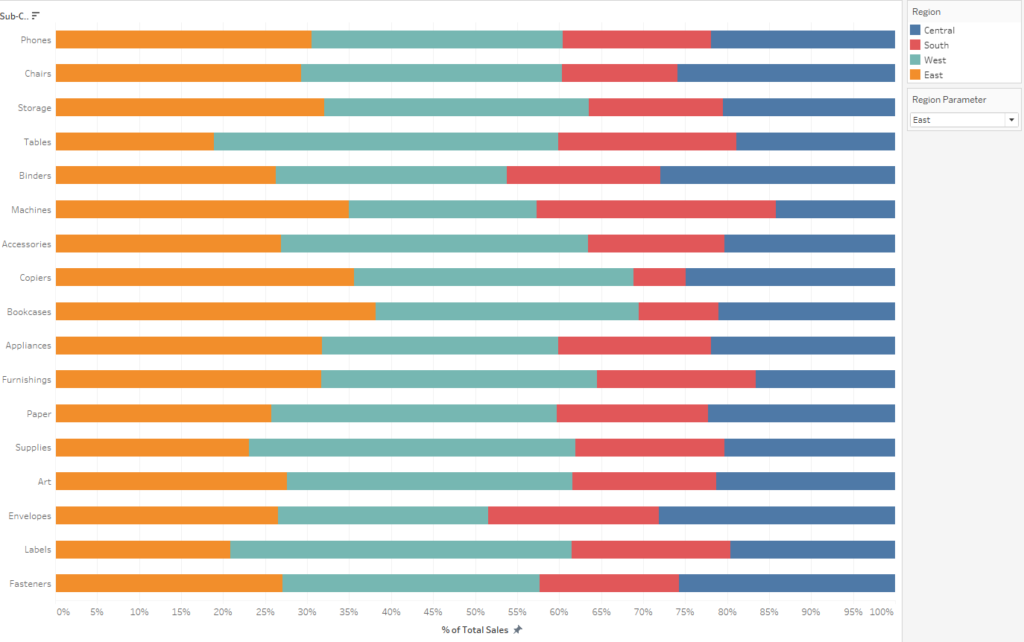
Stacked charts have one fundamental problem – for example, when looking at a stacked bar chart, it’s easy to compare the size of the category that is placed on the 0-axis, as we have a common reference point (bars start from the same point). The situation is similar for the last categories on the 100% axis. Comparing the categories between them becomes difficult, as they don’t have a common reference point:
You can overcome this problem by breaking down the chart into parts to create a panel chart. However, in this approach it’s impossible to identify the categories summing up to 100% – this is not intuitive. Therefore, the choice of the right solution will depend on the circumstances. You could also use both approaches at the same time to present the two charts, or to let the users make their choice.
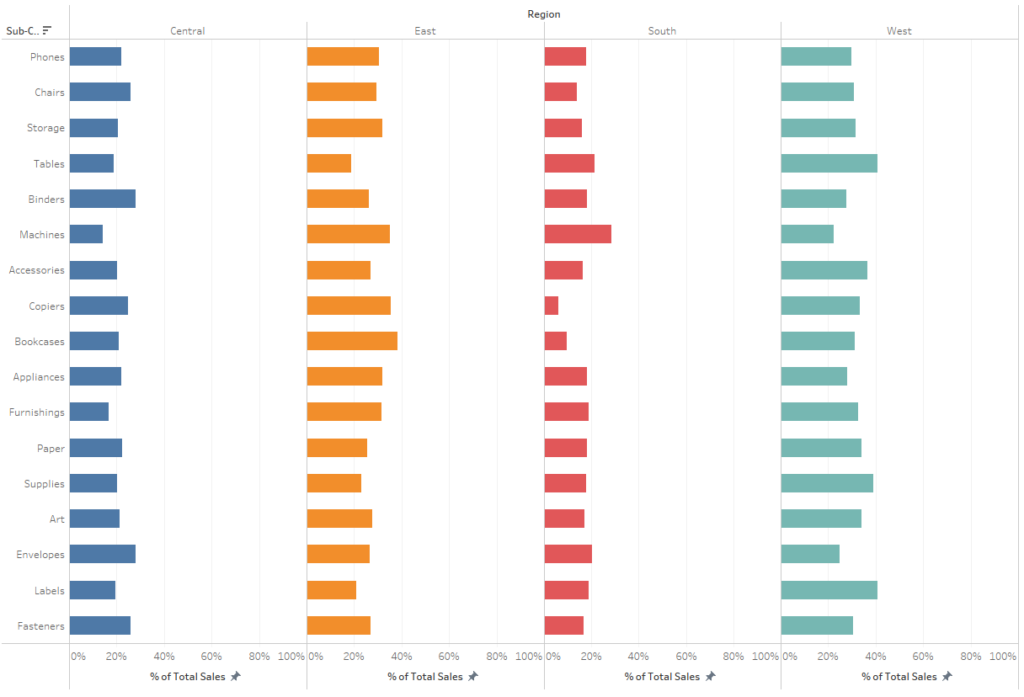
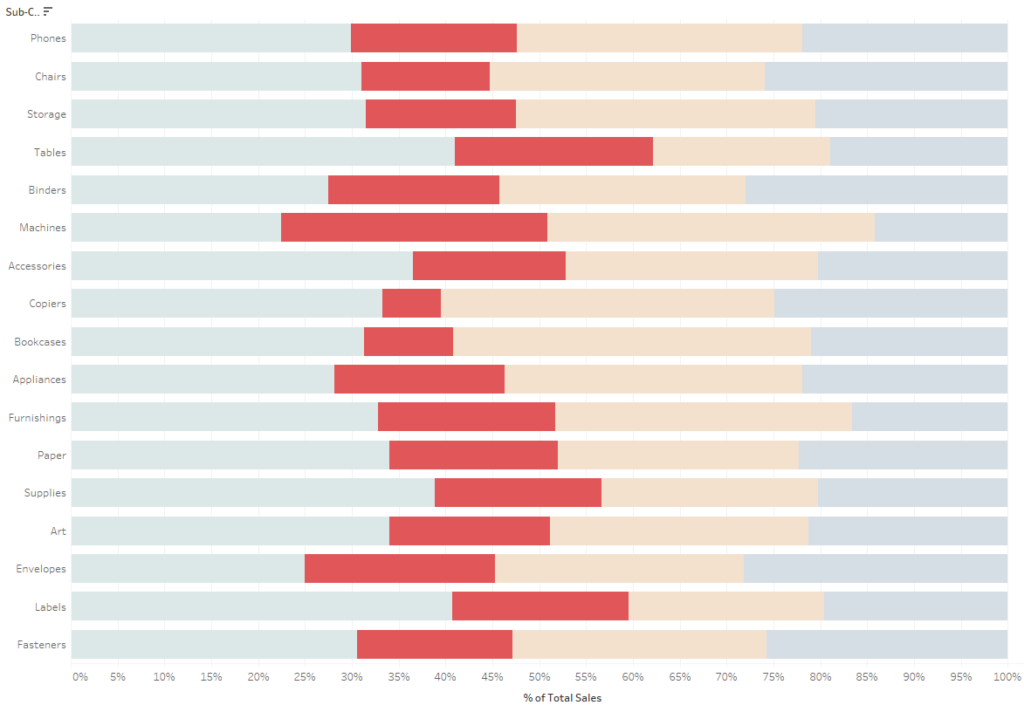
Tableau also provides greater interactivity. For example, you can add a parameter to sort the categories on the chart – in the below example, by using the parameter the user is able to select the category that will be displayed first. This category will automatically get a common reference point, which will make its analysis much easier:
There are quite many options to visualize parts of the whole
In terms of visualizing categories and times, the recommendations were pretty clear, but it’s not the same in the case of visualizing parts of the whole. A different approach would be recommended for visualizing a single state (another approach for various categories). You approach will also vary when you wish to compare the categories or analyze the variability over time. You should keep in mind some basic principles: it’s easy for us to compare lengths or positions, but it’s more difficult to compare areas, and comparing angles is the most difficult. It’s important to have a common reference point when comparing lengths. Taking into account these limitations, you will be able to choose the best chart for visualizing part of the whole.
Mateusz Karmalski, Tableau Author


