The number of UX enthusiasts who place great emphasis on the User Experience is rapidly growing. One of the factors that affect the way the report is perceived is the colour palette used in it. Today we are going to discuss how the Colour Contrast Calculator in Power BI can help you in your work.
Colour palette – where to start
The process of selecting colours should start with learning about the brand colours used by the company for which a report is going to be prepared. If there are no brand colours, choose the palette you would like to use. The colours selected are primarily intended to direct the user’s attention in such a way that they can easily access the information needed. Colours are undoubtedly the key element of the visualization; however, it is reasonable to be moderate and use colours where appropriate only. The colour palette of the report should not interfere with the analytical process; therefore it is vitally important to combine the selected colours in a well-thought manner.
Colour Contrast Calculator in Power BI
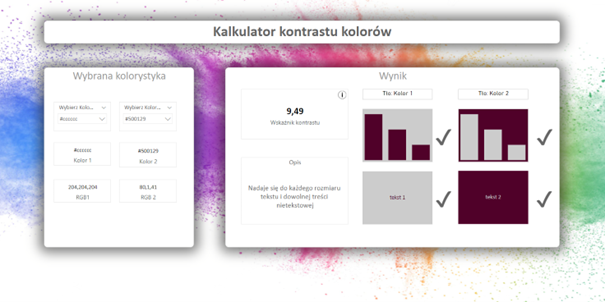
The question arises as to how to properly combine colours? For this purpose, it is worth using a variety of available tools, such as the colour contrast calculator which can be created directly in Power BI. This tool allows you to see whether the contrast between the colours you wish to use is sufficient. Below is the example contrast calculated in Power BI.
The calculator is nothing more than a report created in Power BI based on the dataset generated in Power Query. The dataset consists of columns with R (red), G (green) and B (blue), which are used as a basis to create colours from the RGB palette. In addition, there is a colour column in a hexadecimal format – a HEX code. With such a set of data you can choose the desired colours and calculate their contrast ratio.
Colour contrast and WCAG standards
The colour contrast ratio is calculated in accordance with the guidelines of the WCAG standard. They stipulate that:
· The contrast between the text and the background should not be bigger than 4.5
· The contrast between non-text content (e.g., a chart) and the background should not be bigger than 3.
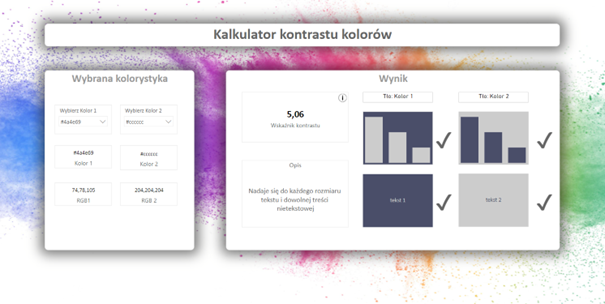
This calculator is fast and simple to use. All you need to do is to select two colours you wish to combine and enter them in the fields “Select Colour 1” and “Select Colour 2” as a HEX code. Below you will see the details of your selection in HEX and RGB formats. On the right, you will see the analysis of the contrast between the two colours. Depending on the choices made, you can receive the following feedback:
- The contrast is appropriate both for text and non-text content
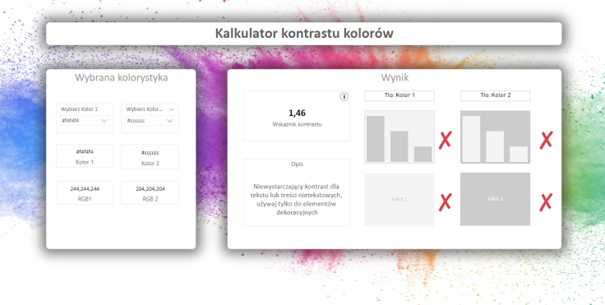
- The contrast is insufficient, and your combination can be used only for decorative elements
- For text, the contrast can be used for large or bold fonts only, and it is sufficient for non-text content
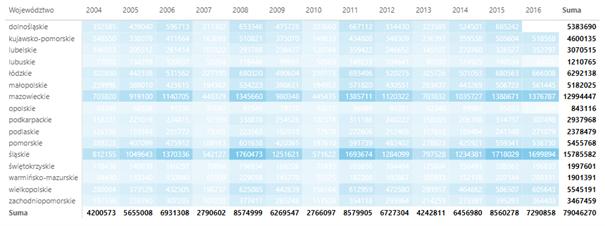
When choosing two colours, you should always aim for getting a ratio consistent with the aforementioned guidelines. The feedback should state that the contrast is sufficient and suggest the combinations, in which this configuration can be applied. Try to avoid combining colours when the feedback says the contrast is insufficient – it will make your report unclear. Let’s imagine that with the use of conditional formatting, the colours of the background and font are combined as shown in the below table.
The contrast between these colours is too small. As a result, the user may draw incorrect conclusions or will spend too much time trying to read the figures in the table. Using the colour contrast calculator will help you avoid these errors, as you will know at the report design stage, what colour combinations should not be used.
Colour Contrast Calculator – the advantages
Using colours in different parts of your visualizations will help present a more impressive story that will quickly attract your audience. The right choice of colours will ensure your reports:
– are well-balanced
– reduce the time needed to analyze the data
– help you quickly and easily understand the message
The colour contrast calculator is a handy tool for those who create reports, as it gives tips on how to correctly use colours. It will certainly help prepare reports which are clearer and more easily understandable for end users.
Below is a link to the contrast calculator created in Power BI. I encourage you to use it.* LINK: https://app.powerbi.com/groups/e2635f2b-81c1-4386-a496-6ee72ebf486b/reports/60f46867-6fcf-4bfe-acc8-438066c48da3/ReportSectiona5504ee40a2e0ce509be?redirectedFromSignup=1
* The report downloads colours slowly due to the large number of possible combinations ** Source of inspiration https://www.workout-wednesday.com/
Joanna Korbecka Power BI Consultant


