Do you work with Explorer and want to combine your data? Or perhaps you have a license for Creator, but your ability to link the data is limited due to data security policies? If yes, you should definitely find out more about Data Blending.
How to combine data in Tableau?
Everyone, who works with Tableau, is aware that sometimes a single table with data is not sufficient and you need to extract additional information from another table. There are several ways to do that. You can ask you data engineer to perform it in SQL, however it is best to do it by yourself. If you have a license for Creator, you have the following three options: joins, relationships and blending. Joins allow you to combine data into one large table. Relationships present tables separately, but they define the way to quickly join the data when needed. Then Tableau will automatically create relevant joins. The last option is blending. The simplest definition would be to say it is the aggregated left join “on the fly.” But what does it mean and when to use it?
The story behind blending
In the past, data blending in Tableau played a significant role as it helped join the data from various databases. Later on, the function Cross Data Join was introduced, which allows us to combine the data by joins, and it took over this capability from blending almost completely. However, blending still helps combine the data at various levels of detail, but these days, it is being pushed out by relationships. When should you use it then?
First of all, it’s suitable for users, who have a license for Explorer. They can create reports only based on ready data sources stored in Tableau Online (Cloud) or Tableau Server. They don’t have access to joins and relationships, but they can use blending.
However, if you have a Creator license, you can work on the source protected in the Row Level Security. Adding a table to your source to configurate the security on the row level makes it almost impossible to use relationships. There is no problem with joins, however they aren’t good when you have data sources with various levels of detail. Blending would be a better choice here.
How does blending work?
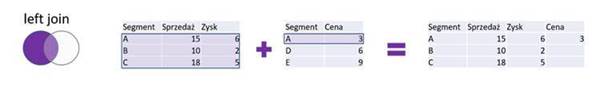
I have already quoted my favourite definition, which says “blending is the aggregated left join on the fly.” What does it mean? The best approach is to explain it step by step. Let’s start with the left join. It is a method allowing to combine two tables in one summary table. In order to do that, start with identifying the key field. This is a column with the dimension that is common for two tables. In the below example, this will be a Segment. Sometimes you may have several common fields and the left join allows you to add to all the rows in the left table (the first table) the rows from the second table, which have the values of the key field in the first table. Where there is no data to be combined, cells are left blank (nulls), as illustrated in the drawing below.
The Left Join is additionally aggregated in blending. This means a different approach in the situation where in the table on the right you have several rows which correspond with the row on the left. In the case of a join, all of these rows will be added to the summary table, each of them separately. In blending, the values from the table on the right-hand side will be aggregated and further processed in the aggregated form. This aggregation is usually the sum as illustrated below.
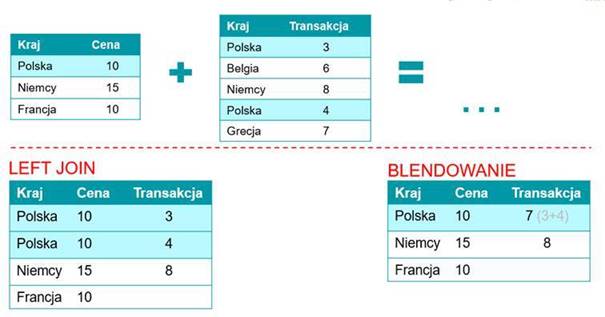
It is the aggregation that makes blending useful when you have various levels of data since it prevents unnecessary duplication of rows.
Last but not least, the term “on the fly.” Blending works the same way as the left join, the only difference is that the left join permanently links the tables. It is an integral part of preparing the source of data, whereas blending is built at the level of one specific visualization and will work in this particular visualization only.
Drawbacks of blending
It is not without a reason that blending has been gradually replaced by other solutions. Also many Tableau users don’t like it for a reason as it has certain drawbacks. The most significant disadvantage is that it doesn’t work for non-additive aggregations. We can sum up – calculate the average. However, you won’t be able to count unique items – COUNTD, or medians. Another issue are all number functions except for MIN() and MAX(). Therefore, you may not be able to calculate roots, cosines on the blended data, or to round them off. In addition, it’s also difficult to calculate LODs based on blending, so these solutions seem to be designed for simpler tasks, but sometimes there is no other choice.
Agata Mężyńska
Tableau Desktop Certified Professional


