NewDataLabs

Tableau - Business Intelligence Tools

  • Solutions
    • ETL
      • Tableau Prep
      • Airflow
      • Power Query
      • Microsoft Integration Services
      • Fivetran
    • Data warehouses
      • Snowflake
      • Google Big QUERY
      • Microsoft SQL Server
      • PostgreSQL
      • Web analytics
      • Amplitude
    • Business Intelligence
      • Tableau
        • What is Tableau?
        • How to implement Tableau properly?
        • Interactive management dashboard
        • Tableau price list
        • Products of Tableau
          • – Tableau Desktop
          • – Tableau Server
          • – Tableau Prep
          • – Tableau Online
        • Tableau Audit
        • Tableau Day
      • Power BI
  • Services
    • Tableau workshops on your data – Proof of Concept
    • Preparation of data – ETL
    • Reporting and data visualization
    • Migration services
    • Tableau training courses
    • Embedded Analytics
  • Salesforce
    • Salesforce CRM
      • Customer relationship management
      • Sale
        • Sales opportunity management
      • Business Intelligence analysis
      • Salesforce Manufacturing Cloud
      • Salesforce Service Cloud
      • Salesforce Marketing Cloud
    • Services
      • Proof of Concept
      • CRM workshops
      • Implementation of CRM
      • Post-implementation support
      • Data migration
      • Salesforce training
      • CRM consultancy
      • Salesforce integrations
    • Tableau + Salesforce
  • About Us
  • Customers
    • Our Customers
    • Customer stories
      • Totalizator Sportowy Sp. z o.o.
      • Snieżka S.A.
      • Werner Kenkel Sp. z o.o.
      • DOZ S.A.
  • Events
    • Webinars >
      • Salesforce
      • Tableau
      • Power BI
    • Tableau Training Courses >
      • New Data Model
      • Tableau online course
      • Tableau training courses
    • Power BI Training Course
  • Blog
  • Download Tableau
    • Tableau Desktop – Trial
    • Tableau Server – Trial
    • Tableau Prep – Trial
    • Tableau Reader
  • Contact
EN / PL

Dynamic Zone Visibility

2023-12-19

From time to time Tableau releases a functionality that is considered by the users as a “real breakthrough”. Such a new feature has been made available just a few days ago, namely the Dynamic Zone Visibility. It is really worthwhile to explore it.

What is Dynamic Zone Visibility?

Dynamic Zone Visibility is a functionality that allows to control, by using various parameters, which elements of the dashboard are visible. This applies to all possible elements, including filters, text fields, and charts.

So far, you could use several other tools to hide the content in the dashboards:

  • Switch between charts by using a parameter
  • Hide the element or container and display it after clicking an icon – Show/Hide Button
  • Make the chart disappear after clicking the action again.

All of these functions allowed us to build almost everything. Unfortunately, it involved “going around” and using rather complicated solutions. Now you can use a very simple tool.

How does it work?

Let’s assume you have a dashboard with two charts –maps of the states and a char bar showing the product groups. In addition, you have a set of filters. On the map, you want to filter the selected state and period, and on the bar chart, a product group and a date.

The initial dashboard would look more or less like this:

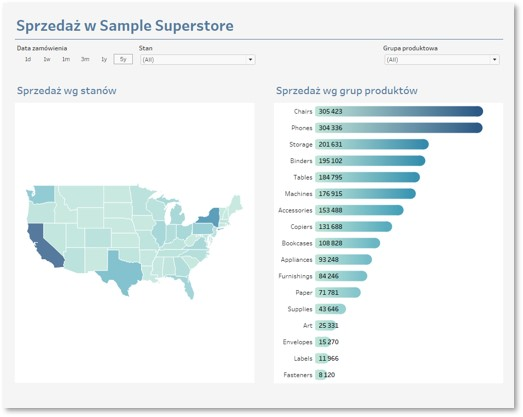
In addition, you don’t want your charts to appear at the same time, but after you click the icon, and you want them to have the necessary filters only.

In order to configure the visibility of the specific parts of your visualization, you will need parameters or fields with the TRUE / FALSE values. In this case, I will create a text parameter that will allow me to choose between the values: “Map” and “Bar chart”. For this purpose, I will create two calculated fields.

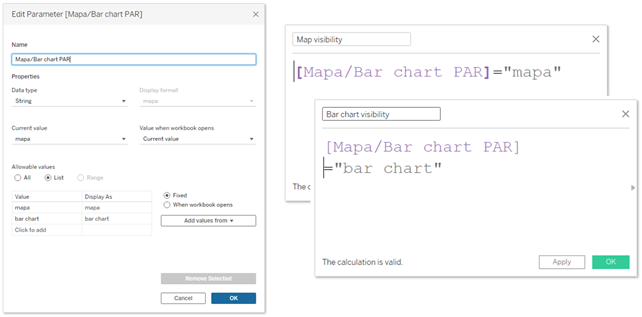
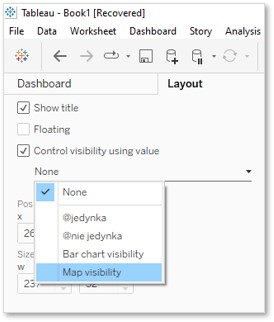
The next step is to assign the specific parts of the chart to the zones. The first zone will consist of the elements that will appear after selecting them from the map parameter. These are the elements, for which the Map Visibility field will have the TRUE value. It applies both to the map and the State filter. Similarly, the second zone for the bar chart will be created. Such filters as title, highlights and date must always be visible, so they will not be assigned to the zones. The specific elements are allocated to the zones in the Layout tab in your dashboard. First you need to select Control visibility using value, and then indicate the field that will control the zone.

Once the configuration is completed, you will see the following outcome:

From here it is easy to change the parameter control to icons which, when you click them, will trigger action on the parameter. After some more minutes of work, the interaction with your dashboard could look as follows:

Summary: Advantages of Dynamic Zone Visibility

This tool has some very significant advantages. Number one is its simplicity. You can learn how to use it in just a few minutes. Number two is its efficiency. Tableau will spend time on rendering the elements that are to be displayed in a given moment. If you divide your dashboard into several zones of visibility, you will save time on loading the images. Last but not least, the most effective strategy in Tableau is to use the Visual Analytics. It allows you to navigate through several visualizations and narrow the amount of data in each of them. As a result, when you review detailed information, it isn’t overwhelming, and you get to see only the required data. By using zones, this approach can be much simpler.

Agata Mężyńska, Tableau Desktop Certified Professional

Webinars
> Amplitude Webinars
> Tableau Webinars
> Power BI Webinars

Tableau training courses
Power BI online course
ETL
> Tableau Prep
> Airflow
> Power Query
> Microsoft Integration Services
Data warehouses
> Snowflake
> Google BigQuery
> Microsoft SQL Server
> PostgreSQL
Business intelligence
> Tableau
> Salesforce
> Power BI
Web analytics
> Amplitude
Salesforce
> Customer relationship management
> Sale
> Sales opportunity management
> Analysis Business Intelligence
> Salesforce Manufacturing Cloud
> Salesforce Service Cloud
> Salesforce Marketing Cloud
Contact

contact@newdatalabs.com


601797783
+48 781 648 194


Adres
Correspondence address:
al. T. Boy’a – Żeleńskiego 26,
51-160 Wrocław

Copyright © 2025

Manage Consent
To provide the best experiences, we use technologies like cookies to store and/or access device information. Consenting to these technologies will allow us to process data such as browsing behavior or unique IDs on this site. Not consenting or withdrawing consent, may adversely affect certain features and functions.
Functional Always active
The technical storage or access is strictly necessary for the legitimate purpose of enabling the use of a specific service explicitly requested by the subscriber or user, or for the sole purpose of carrying out the transmission of a communication over an electronic communications network.
Preferences
The technical storage or access is necessary for the legitimate purpose of storing preferences that are not requested by the subscriber or user.
Statistics
The technical storage or access that is used exclusively for statistical purposes. The technical storage or access that is used exclusively for anonymous statistical purposes. Without a subpoena, voluntary compliance on the part of your Internet Service Provider, or additional records from a third party, information stored or retrieved for this purpose alone cannot usually be used to identify you.
Marketing
The technical storage or access is required to create user profiles to send advertising, or to track the user on a website or across several websites for similar marketing purposes.
Manage options Manage services Manage {vendor_count} vendors Read more about these purposes
View preferences
{title} {title} {title}
The newdatalabs.com/en website uses cookies. We use information saved using cookies and similar technologies, including for advertising and statistical purposes and to adapt our website to the individual needs of users. By continuing to use the site, you agree to the terms.Close