Dynamic Zone Visibility was launched in the 2022.3 version and although it’s not a revolutionary solution, it will definitely make creating dashboards easier. Why not a revolution? Because similar effects could be achieved earlier, however, a more complicated approach was required. Tableau has now significantly simplified the dynamic control of the content with the Dynamic Zone Visibility function. How does it work? I am going to describe it below and provide examples of practical applications of this solution.
Brief overview before practice
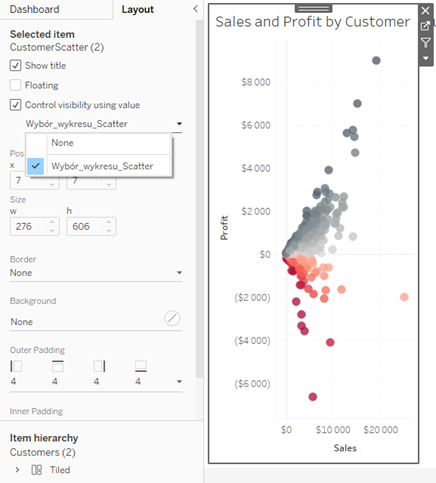
Before discussing practical applications, I will briefly explain how this functionality works. The new option can be accessed when creating a dashboard. Click the element in the Layout tab to see the new function – Control visibility using value:
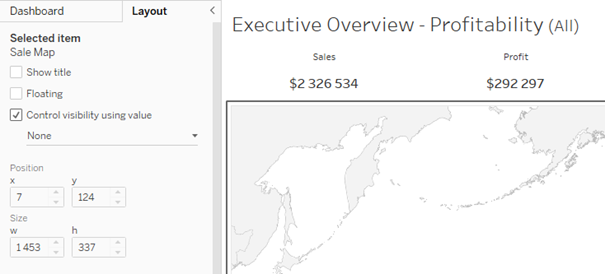
The default value is None. You can select a parameter or calculation field which must satisfy three conditions: it must be a Boolean field (True/False), it must have one value (True or False), and it must be a global value, irrespective of the visualization, returning a fixed value (such as LOD calculations). If the field or parameter meets these conditions – you will find it in a dropdown list. You can use it to control the content of the dashboard.
Use Case #1 – swapping the charts
To demonstrate how it works in practice, we will start with the basic application of Dynamic Zone Visibility, which involves swapping charts in the dashboard. We want to control which chart is going to be displayed, depending on the parameter selected. Initially, there are three charts in the dashboard:
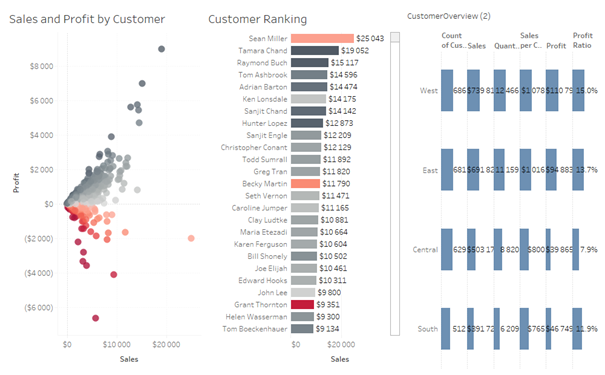
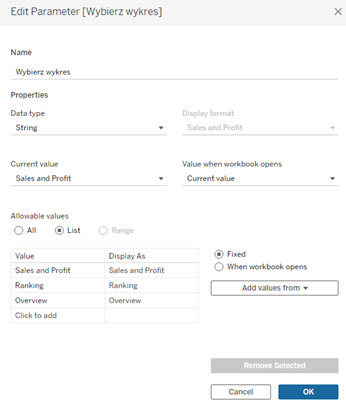
The charts are compressed and illegible, so you need to use the Dynamic Zone Visibility. Start with creating a parameter: Select Chart to be able to select a chart with three options:
The parameter is a text format, and the control of the visibility must be done with the fields accepting the True/False values. For this purpose, create a Boolean calculation field:
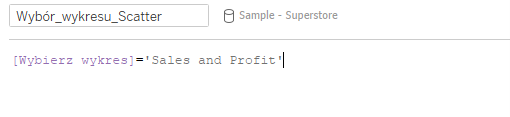
In the next step, add this field to Details of your visualization. Then select your Scatter plot in the dashboard, click Control visibility using value, and select your newly created calculation field:
Using this parameter, you can control how your chart is displayed. More precisely, you can control the value of the calculation field that will decide about visibility of the element in the dashboard.
You need to repeat the process for subsequent charts, by creating two additional calculation fields. Next, you add them to Details and then assign them to the Control visibility using the value field. The final effect will be as follows:
Use Case #2 – displaying/hiding the Filter pane
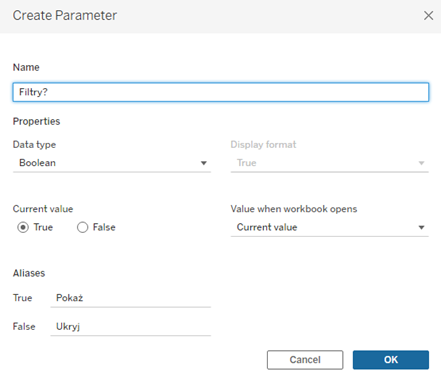
The Dynamic Zone Visibility function can also be used to display/hide the Filter or Legend panes. To get more space in the dashboard, this pane often is hidden and is used only when a change is needed. First, you create a Boolean parameter: Filters?, with the assigned description: Show/Hide for the True/False value:
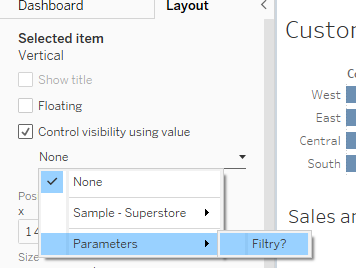
Next, go to the dashboard and select your pane, followed by choosing Control visibility using value and select Filters? from the list of Parameters:
Ready – you can control the display of the pane using this parameter. In the previous example, you had to use the calculation field for this purpose, here it is directly the Boolean parameter.
The question arises: Why not use the Add Show/Hide button for the container? It will work the same way; however, the parameter can control more than one element in the dashboard. If you add a title here, one parameter will manage the visibility of two elements. The Show/Hide button does not have this function. This is what it looks like in practice:
Use Case #3 – Zooming charts
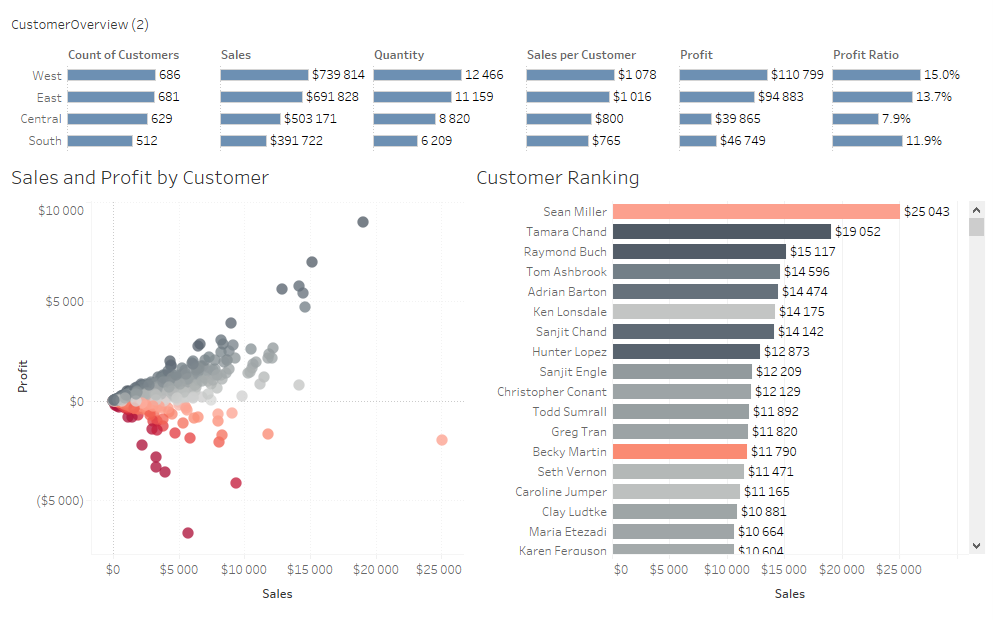
Let’s go back to the example with charts and assume we want to show all charts to give users the option to zoom one chart and hide the other ones. The base dashboard with three charts will look as follows:
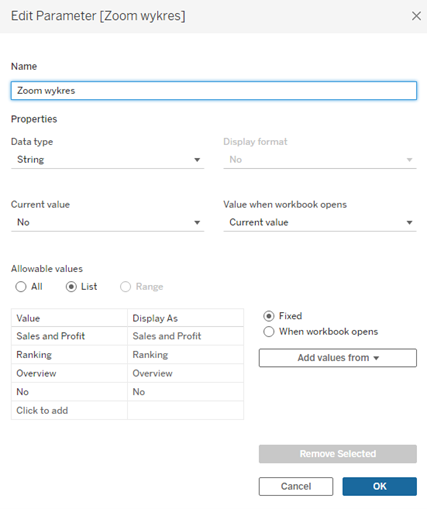
In the first step, create a text type parameter: Zoom Chart, similar to the previous Select Chart, but with an additional No option:
The next step is to create calculation fields that return the True value when selecting a single chart or No:
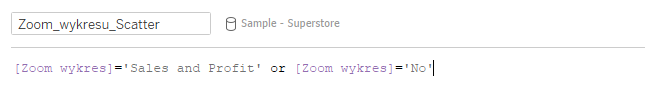
Lastly, add new calculation fields in the Details of the specific charts and select these fields from the list after choosing Control visibility using value. You will get the following result:
Dynamic Zone Visibility offers new capabilities
The Dynamic Zone Visibility function is a very useful tool that makes Tableau even more flexible. The previous, complex hiding/showing content functionalities are now much more accessible and simpler to use. They allow you to tailor one dashboard to the needs of various users – by defining the elements visible in the dashboard based on usernames. It is also the case with days of the week – for example, in the automatic update of the dashboard you can see the previous or current day. It’s also easier now to prepare the dashboard in various colour versions (e.g., light/dark). Typically, there are many applications, and the functionality of this solution proves that Tableau can easily adapt to different user needs.
Mateusz Karmalski Tableau Author


