NewDataLabs

Tableau - Business Intelligence Tools

  • Solutions
    • ETL
      • Tableau Prep
      • Airflow
      • Power Query
      • Microsoft Integration Services
      • Fivetran
    • Data warehouses
      • Snowflake
      • Google Big QUERY
      • Microsoft SQL Server
      • PostgreSQL
      • Web analytics
      • Amplitude
    • Business Intelligence
      • Tableau
        • What is Tableau?
        • How to implement Tableau properly?
        • Interactive management dashboard
        • Tableau price list
        • Products of Tableau
          • – Tableau Desktop
          • – Tableau Server
          • – Tableau Prep
          • – Tableau Online
        • Tableau Audit
        • Tableau Day
      • Power BI
  • Services
    • Tableau workshops on your data – Proof of Concept
    • Preparation of data – ETL
    • Reporting and data visualization
    • Migration services
    • Tableau training courses
    • Embedded Analytics
  • Salesforce
    • Salesforce CRM
      • Customer relationship management
      • Sale
        • Sales opportunity management
      • Business Intelligence analysis
      • Salesforce Manufacturing Cloud
      • Salesforce Service Cloud
      • Salesforce Marketing Cloud
    • Services
      • Proof of Concept
      • CRM workshops
      • Implementation of CRM
      • Post-implementation support
      • Data migration
      • Salesforce training
      • CRM consultancy
      • Salesforce integrations
    • Tableau + Salesforce
  • About Us
  • Customers
    • Our Customers
    • Customer stories
      • Totalizator Sportowy Sp. z o.o.
      • Snieżka S.A.
      • Werner Kenkel Sp. z o.o.
      • DOZ S.A.
  • Events
    • Webinars >
      • Salesforce
      • Tableau
      • Power BI
    • Tableau Training Courses >
      • New Data Model
      • Tableau online course
      • Tableau training courses
    • Power BI Training Course
  • Blog
  • Download Tableau
    • Tableau Desktop – Trial
    • Tableau Server – Trial
    • Tableau Prep – Trial
    • Tableau Reader
  • Contact
EN / PL

Histogram: how to filter it?

2022-07-03

Narrowing the data used to draw the histogram is trivial. But what if we want to remove outliers from the view without changing the results? This can be more difficult, and still very useful. I invite you to read the next post “Histogram. How do you filter it?” inspired by working with clients.

Histogram: let’s start with a real case

The most interesting assignments almost always happen with our clients. Just drawing a histogram is, of course, a simple matter. Show it for a specific market segment as well. Sometimes, however, all it takes is one look at the chart for the sacramental “But why is it so empty here! Is there anything we can do about it?” Sure!

Reproducing the situation based on Sample Superstore data, I could draw a graph like this, for example:

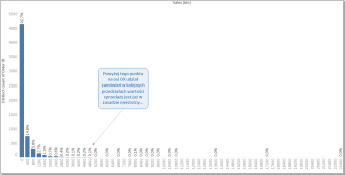
It shows the distribution of the number of orders divided into order value ranges of $400 each. That is, in this chart, orders between $0 and $400 account for 92.7% of all orders. As you can easily see most of the results are concentrated on the left. At least 2/3 of the graph area is of little relevance to the analysis. It’s a waste of space that you can’t usually afford on a dashboard. What can we do? We can filter out some of the compartments on the right.

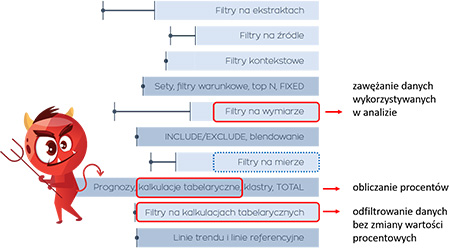
Histogram filtering and the order of operations

The easiest to filter is the range of data used to build the analysis. For example, select one of the regions and the visualization will adapt to the situation. The height and distribution of the posts will be recalculated. The percentages on the bars will also adjust accordingly. Here we use a filter on the dimension, e.g. [Segment],

If there are no labels on the histogram or they match the counts on the bars, the matter is also simple. A measure filter will suffice. Which one? To narrow the result horizontally, we filter by the measure on which the intervals for the histogram (bins) are built.

Worse – and this is usually the case – is when we have percentages in the posts. These are created using table calculations. As you can see in the illustration below, table calculations are calculated later in Tableau than filters on measures. In this situation, it means that if we filter out the bars on the right with the filter to a large extent, the percentages will be counted again. So that they add up to 100% in the visualization. A viewer viewing a narrowed graph will then get the impression that they are seeing all of the results, not just the most relevant part. So what do you need to do to ensure that filtering does not change the percentages on the labels? You need to use the filter after the table calculation.

Filters after table calculation

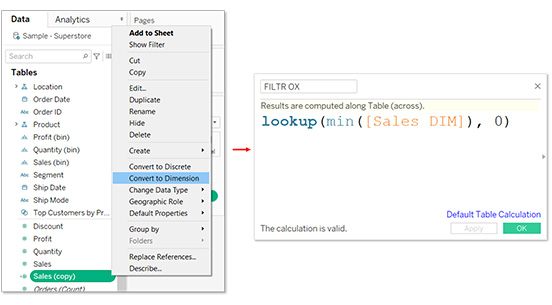
How to create a filter by measure or by dimension is known to anyone, even a novice Tableau user. It is slightly more difficult to deal with filters after a tabular calculation. They must themselves be built from tabular calculations as well. They use the LOOKUP() function. In such a filter, it is of the form: LOOKUP ( MIN( [DIMENSION] ), 0)

However, one more problem remains to be solved. In the case described, it is necessary to filter by the axis containing the sales measure intervals rather than the dimension. This can be circumvented by creating a copy of the [Sales] measure, turning it into a dimension and naming it [Sales DIM]. Now we can create a calculation for filtering:

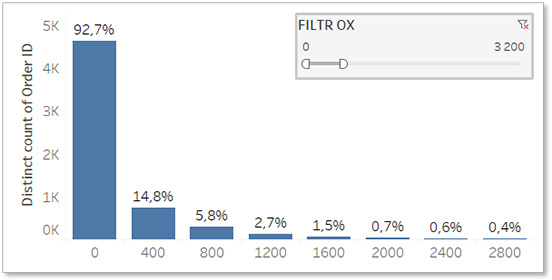
The FILTER OX field just needs to be placed on the Filter shelf and you can decide if you want null values to be shown. Once the filter control is displayed, it’s easy to get the view the customer wanted. The view is narrowed to the most relevant part, and the percentage of the $0 to $400 range consistently remains at 92.7%.

Histogram: for more information, see: The histogram and its mysteries.

Agata MężyńskaTableau Desktop Certified Professional

Webinars
> Amplitude Webinars
> Tableau Webinars
> Power BI Webinars

Tableau training courses
Power BI online course
ETL
> Tableau Prep
> Airflow
> Power Query
> Microsoft Integration Services
Data warehouses
> Snowflake
> Google BigQuery
> Microsoft SQL Server
> PostgreSQL
Business intelligence
> Tableau
> Salesforce
> Power BI
Web analytics
> Amplitude
Salesforce
> Customer relationship management
> Sale
> Sales opportunity management
> Analysis Business Intelligence
> Salesforce Manufacturing Cloud
> Salesforce Service Cloud
> Salesforce Marketing Cloud
Contact

contact@newdatalabs.com


601797783
+48 781 648 194


Adres
Correspondence address:
al. T. Boy’a – Żeleńskiego 26,
51-160 Wrocław

Copyright © 2025

Manage Consent
To provide the best experiences, we use technologies like cookies to store and/or access device information. Consenting to these technologies will allow us to process data such as browsing behavior or unique IDs on this site. Not consenting or withdrawing consent, may adversely affect certain features and functions.
Functional Always active
The technical storage or access is strictly necessary for the legitimate purpose of enabling the use of a specific service explicitly requested by the subscriber or user, or for the sole purpose of carrying out the transmission of a communication over an electronic communications network.
Preferences
The technical storage or access is necessary for the legitimate purpose of storing preferences that are not requested by the subscriber or user.
Statistics
The technical storage or access that is used exclusively for statistical purposes. The technical storage or access that is used exclusively for anonymous statistical purposes. Without a subpoena, voluntary compliance on the part of your Internet Service Provider, or additional records from a third party, information stored or retrieved for this purpose alone cannot usually be used to identify you.
Marketing
The technical storage or access is required to create user profiles to send advertising, or to track the user on a website or across several websites for similar marketing purposes.
Manage options Manage services Manage {vendor_count} vendors Read more about these purposes
View preferences
{title} {title} {title}