NewDataLabs

Tableau - Business Intelligence Tools

  • Solutions
    • ETL
      • Tableau Prep
      • Airflow
      • Power Query
      • Microsoft Integration Services
      • Fivetran
    • Data warehouses
      • Snowflake
      • Google Big QUERY
      • Microsoft SQL Server
      • PostgreSQL
      • Web analytics
      • Amplitude
    • Business Intelligence
      • Tableau
        • What is Tableau?
        • How to implement Tableau properly?
        • Interactive management dashboard
        • Tableau price list
        • Products of Tableau
          • – Tableau Desktop
          • – Tableau Server
          • – Tableau Prep
          • – Tableau Online
        • Tableau Audit
        • Tableau Day
      • Power BI
  • Services
    • Tableau workshops on your data – Proof of Concept
    • Preparation of data – ETL
    • Reporting and data visualization
    • Migration services
    • Tableau training courses
    • Embedded Analytics
  • Salesforce
    • Salesforce CRM
      • Customer relationship management
      • Sale
        • Sales opportunity management
      • Business Intelligence analysis
      • Salesforce Manufacturing Cloud
      • Salesforce Service Cloud
      • Salesforce Marketing Cloud
    • Services
      • Proof of Concept
      • CRM workshops
      • Implementation of CRM
      • Post-implementation support
      • Data migration
      • Salesforce training
      • CRM consultancy
      • Salesforce integrations
    • Tableau + Salesforce
  • About Us
  • Customers
    • Our Customers
    • Customer stories
      • Totalizator Sportowy Sp. z o.o.
      • Snieżka S.A.
      • Werner Kenkel Sp. z o.o.
      • DOZ S.A.
  • Events
    • Webinars >
      • Salesforce
      • Tableau
      • Power BI
    • Tableau Training Courses >
      • New Data Model
      • Tableau online course
      • Tableau training courses
    • Power BI Training Course
  • Blog
  • Download Tableau
    • Tableau Desktop – Trial
    • Tableau Server – Trial
    • Tableau Prep – Trial
    • Tableau Reader
  • Contact
EN / PL

Is Combo Chart a Dual Axis?

2024-01-08

A dual-axis chart is a tool that every Tableau user can quickly learn how to use it. Sometimes you may come across a Combo Chart. At times, these names are used interchangeably, but not always and incorrectly. In the list of terms for Tableau certificates these are two separate positions. Today I’m going to explain how they differ and what tricks help work with them.

Dual Axis Tableau: a review of the dual axis

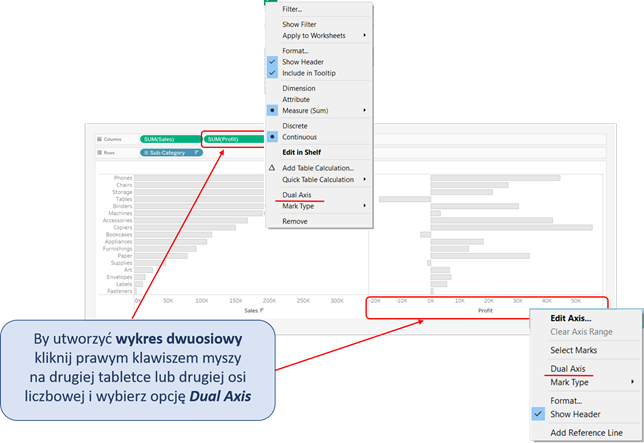
As the name suggests, a dual axis combines two measures in the same visualization with a parallel scale for each o them. When we have two pills on the Rows or Columns shelf, the steps are straightforward. You need to right-click on the second pill or second numerical axis. From the displayed menu, select Dual Axis and that’s it. Not really, as the following question should come to our minds: Should the axes be synchronized? If yes, click again on the second axis and select the Synchronized Axis option.

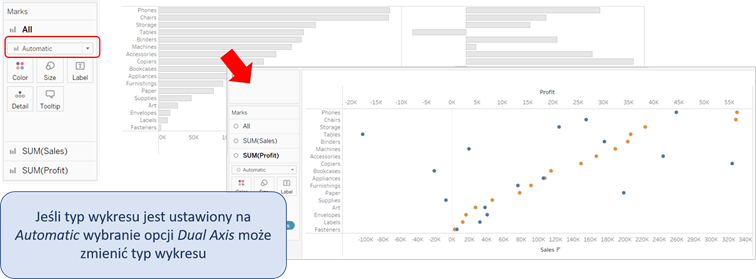
There also one “but”. It happens quite often, when your axes are based on the automatically selected chart, the chart would be modified when the axes are being connected. For example, a bar chart can suddenly change into a dot plot.

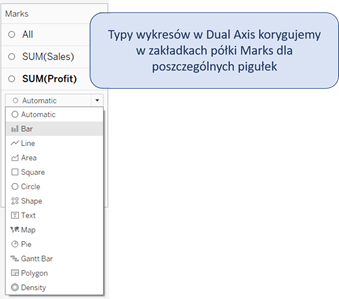
You can easily repair it, by going to the Marks shelf, and in the tabs corresponding to the relevant pills change the types of charts to the ones you need. If you do that before the axes are combined, there will be no problem.

What is a Combo Chart?

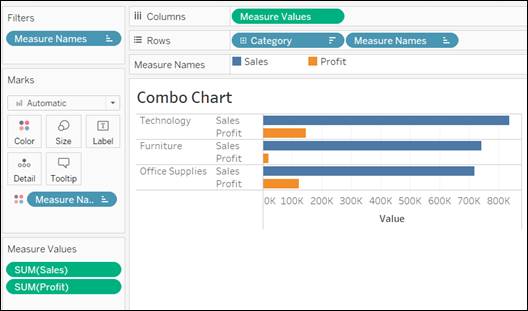
A Combo is a type of chart that allows us to get two or more measures at the same time. The only issue is that they will not have separate axes. To create it, we use the fields automatically created by Tableau [Measure Names] and [Measure Values]. If you want to do build it manually, start from placing the [Measure Names] pill on the Filters shelf. This will allow you to choose the measure you want to work with. Next, place on the shelves the fields [Measure Names], [Measure Values] and any dimension that you need. As a result, the measures will appear next to each other and there can be more than two measures at a time.

Combo Chart and Dual Axis- quick tricks!

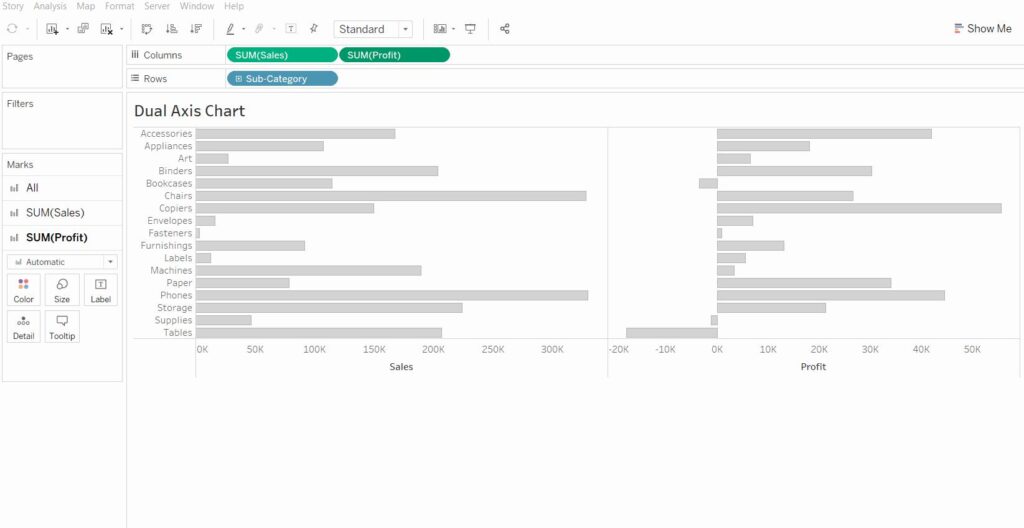
In Tableau, you are able to achieve the same result in a number of ways. For example, the Dual Axis and Combo Chart are for those, who like to keep it simple. Let’s start from drawing the simplest chart for modification, such as a sales bar chart for selected subcategories. When the chart is ready, we can start extending it by adding another measure. Let’s take Profit and pull it over… Where? It depends on the expected result. For Dual Axis – pull it on the top part of the chart. A dotted line will appear above the chart and a small green rectangle with a metric scale. When you let the mouse go, the chart will change into a Dual Axis.

When you pull the measure pill on the lower part of the chart – on the axis – two green rectangles with scales will appear. Let the mouse go, and you will get a Combo Chart. Simple and hassle-free.

Agata Mężyńska,

Tableau Desktop Certified Professional

Webinars
> Amplitude Webinars
> Tableau Webinars
> Power BI Webinars

Tableau training courses
Power BI online course
ETL
> Tableau Prep
> Airflow
> Power Query
> Microsoft Integration Services
Data warehouses
> Snowflake
> Google BigQuery
> Microsoft SQL Server
> PostgreSQL
Business intelligence
> Tableau
> Salesforce
> Power BI
Web analytics
> Amplitude
Salesforce
> Customer relationship management
> Sale
> Sales opportunity management
> Analysis Business Intelligence
> Salesforce Manufacturing Cloud
> Salesforce Service Cloud
> Salesforce Marketing Cloud
Contact

contact@newdatalabs.com


601797783
+48 781 648 194


Adres
Correspondence address:
al. T. Boy’a – Żeleńskiego 26,
51-160 Wrocław

Copyright © 2025

Manage Consent
To provide the best experiences, we use technologies like cookies to store and/or access device information. Consenting to these technologies will allow us to process data such as browsing behavior or unique IDs on this site. Not consenting or withdrawing consent, may adversely affect certain features and functions.
Functional Always active
The technical storage or access is strictly necessary for the legitimate purpose of enabling the use of a specific service explicitly requested by the subscriber or user, or for the sole purpose of carrying out the transmission of a communication over an electronic communications network.
Preferences
The technical storage or access is necessary for the legitimate purpose of storing preferences that are not requested by the subscriber or user.
Statistics
The technical storage or access that is used exclusively for statistical purposes. The technical storage or access that is used exclusively for anonymous statistical purposes. Without a subpoena, voluntary compliance on the part of your Internet Service Provider, or additional records from a third party, information stored or retrieved for this purpose alone cannot usually be used to identify you.
Marketing
The technical storage or access is required to create user profiles to send advertising, or to track the user on a website or across several websites for similar marketing purposes.
Manage options Manage services Manage {vendor_count} vendors Read more about these purposes
View preferences
{title} {title} {title}
The newdatalabs.com/en website uses cookies. We use information saved using cookies and similar technologies, including for advertising and statistical purposes and to adapt our website to the individual needs of users. By continuing to use the site, you agree to the terms.Close