NewDataLabs

Tableau - Business Intelligence Tools

  • Solutions
    • ETL
      • Tableau Prep
      • Airflow
      • Power Query
      • Microsoft Integration Services
      • Fivetran
    • Data warehouses
      • Snowflake
      • Google Big QUERY
      • Microsoft SQL Server
      • PostgreSQL
      • Web analytics
      • Amplitude
    • Business Intelligence
      • Tableau
        • What is Tableau?
        • How to implement Tableau properly?
        • Interactive management dashboard
        • Tableau price list
        • Products of Tableau
          • – Tableau Desktop
          • – Tableau Server
          • – Tableau Prep
          • – Tableau Online
        • Tableau Audit
        • Tableau Day
      • Power BI
  • Services
    • Tableau workshops on your data – Proof of Concept
    • Preparation of data – ETL
    • Reporting and data visualization
    • Migration services
    • Tableau training courses
    • Embedded Analytics
  • Salesforce
    • Salesforce CRM
      • Customer relationship management
      • Sale
        • Sales opportunity management
      • Business Intelligence analysis
      • Salesforce Manufacturing Cloud
      • Salesforce Service Cloud
      • Salesforce Marketing Cloud
    • Services
      • Proof of Concept
      • CRM workshops
      • Implementation of CRM
      • Post-implementation support
      • Data migration
      • Salesforce training
      • CRM consultancy
      • Salesforce integrations
    • Tableau + Salesforce
  • About Us
  • Customers
    • Our Customers
    • Customer stories
      • Totalizator Sportowy Sp. z o.o.
      • Snieżka S.A.
      • Werner Kenkel Sp. z o.o.
      • DOZ S.A.
  • Events
    • Webinars >
      • Salesforce
      • Tableau
      • Power BI
    • Tableau Training Courses >
      • New Data Model
      • Tableau online course
      • Tableau training courses
    • Power BI Training Course
  • Blog
  • Download Tableau
    • Tableau Desktop – Trial
    • Tableau Server – Trial
    • Tableau Prep – Trial
    • Tableau Reader
  • Contact
EN / PL

LOD calculations also in Tableau Prep

2020-11-18

The ability to use LOD (Level of Detail Calculations) in Tableau Prep is one of the most anticipated innovations in this tool. Until now, they required some skill and cleverness. Now, from version 2019.3 onwards, they are available to everyone.

What are LOD calculations

Level of Detail Calculations, also known as LOD, are calculations of the level of detail. In Tableau Desktop this means showing data in a different level of detail than our visualization. By comparing sales in the provinces, we compare them to the results of the macroregion. Or the opposite. We reach for the results of the best and the worst district in each province. A special feature of LOD is that although they sum up or average the data, Tableau does not treat them as aggregates. What does that mean?

In Tableau we have calculations at the level of individual values from the source table or at the level of aggregation. Let’s take a table where in each row we have the order values of one customer, and the columns are consecutive months. Comparing two consecutive months we can do it at the level of a row – by placing orders for each client separately. We can also compare aggregated values – e.g. sums from columns for each month. As a rule, these types of calculations cannot be mixed up in Tableau. LOD calculations are an exception. How is it happening?

Suppose that we have data on profits throughout Poland, presented on a regional map. We want to add to the analysis the best and the worst county in each province and the national average. In the LOD calculation we will determine the level of analysis (counties/ Poland) and type of aggregation (MIN/ MAX/ AVG). Tableau will assign the calculated result to each row of data. Each of them will be accompanied by information on profit and sales for the best and worst county and an average for the whole country.

Technically, we have three functions that allow it. The FIXED function determines the level of analysis, no matter what we have in the chart. The INCLUDE function attaches additional levels of analysis to the visualization and the EXCLUDE function removes selected dimensions from it. Their characteristic feature is their specific syntax with braces, e.g.:

{FIXED [Region]: AVG ([Sales])}

LOD in Tableau Prep Builder

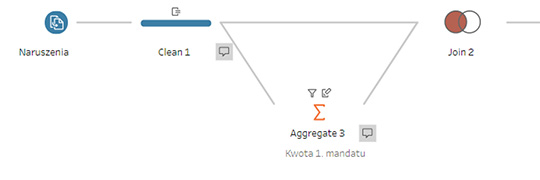
There is no visualization in Tableau Prep. Only a table with data rows is available. Hence the simple conclusion that only the FIXED function can be used here. And this one aggregates data at a given level. If someone has already worked with Tableau Prep, they know it’s not new. The Aggregate step makes it possible for a long time. So what have we gained from LOD? The data can be easily combined in the same table at different aggregation levels. A simple aggregation “rolls up” the table. Instead of e.g. 250 lines, after calculating the provincial averages we will get 16 lines. Until recently, the LOD effect was achieved by combining the aggregated table with the original one as below.

Today the additional Aggregate step and the additional Join step can be replaced by a simple and familiar Tableau Desktop calculation. That’s not everything. In the near future, Tableau Prep Builder will also offer a special simplified interface for creating detail level calculations. Additionally, it will be used to obtain the RANK function in Prep.

For now, however, it is worth remembering the old method of obtaining LOD calculations in Tableau Prep Builder. Why? The program so far supports only the simplest of their characters. We will still have to wait for the possibility of nesting a complicated calculation. But we can already speed things up a lot.

Webinars
> Amplitude Webinars
> Tableau Webinars
> Power BI Webinars

Tableau training courses
Power BI online course
ETL
> Tableau Prep
> Airflow
> Power Query
> Microsoft Integration Services
Data warehouses
> Snowflake
> Google BigQuery
> Microsoft SQL Server
> PostgreSQL
Business intelligence
> Tableau
> Salesforce
> Power BI
Web analytics
> Amplitude
Salesforce
> Customer relationship management
> Sale
> Sales opportunity management
> Analysis Business Intelligence
> Salesforce Manufacturing Cloud
> Salesforce Service Cloud
> Salesforce Marketing Cloud
Contact

contact@newdatalabs.com


601797783
+48 781 648 194


Adres
Correspondence address:
al. T. Boy’a – Żeleńskiego 26,
51-160 Wrocław

Copyright © 2025

Manage Consent
To provide the best experiences, we use technologies like cookies to store and/or access device information. Consenting to these technologies will allow us to process data such as browsing behavior or unique IDs on this site. Not consenting or withdrawing consent, may adversely affect certain features and functions.
Functional Always active
The technical storage or access is strictly necessary for the legitimate purpose of enabling the use of a specific service explicitly requested by the subscriber or user, or for the sole purpose of carrying out the transmission of a communication over an electronic communications network.
Preferences
The technical storage or access is necessary for the legitimate purpose of storing preferences that are not requested by the subscriber or user.
Statistics
The technical storage or access that is used exclusively for statistical purposes. The technical storage or access that is used exclusively for anonymous statistical purposes. Without a subpoena, voluntary compliance on the part of your Internet Service Provider, or additional records from a third party, information stored or retrieved for this purpose alone cannot usually be used to identify you.
Marketing
The technical storage or access is required to create user profiles to send advertising, or to track the user on a website or across several websites for similar marketing purposes.
Manage options Manage services Manage {vendor_count} vendors Read more about these purposes
View preferences
{title} {title} {title}