LOD (Level Of Details) calculations, already introduced in Tableau 9.0, have introduced a small revolution in the flexibility of Tableau calculations. Why are they unique? Simply put, LOD calculations allow us to create and display calculations at a different level of detail than the data displayed in our visualization. When creating calculations in Tableau, we can create them at the row level (row level) – for example, [sales] / [orders]. The second option is to aggregate the measures – that is, sum([sales]) / sum ([orders]). If we wanted to know the difference between a measure and its average – for example, [sales] – avg([sales]), Tableau would return the error Cannot mix aggregate and non- aggregate arguments with this function. With LOD, such calculations are possible, which will give them analysts more flexibility in their calculations.
FIXED LOD – we freeze the dimensions
The easiest way to understand the LOD concept is with the expression FIXED. This expression freezes the dimensions according to which the measure is calculated for the given aggregation (sum, avg, min, max, etc.). The syntax of the expression is as follows (we always dress LOD expressions in curly brackets):
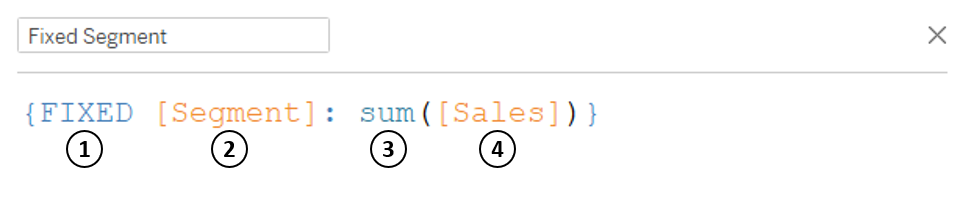
- – type of LOD expression (besides FIXED there are INCLUDE and EXCLUDE – about these expressions in the next paragraph)
- – dimensions according to which the aggregation will take place (can be zero, one and more – then we list them after a comma)
- – aggregation method (sum, average, min, max, etc.)
- – aggregate measure
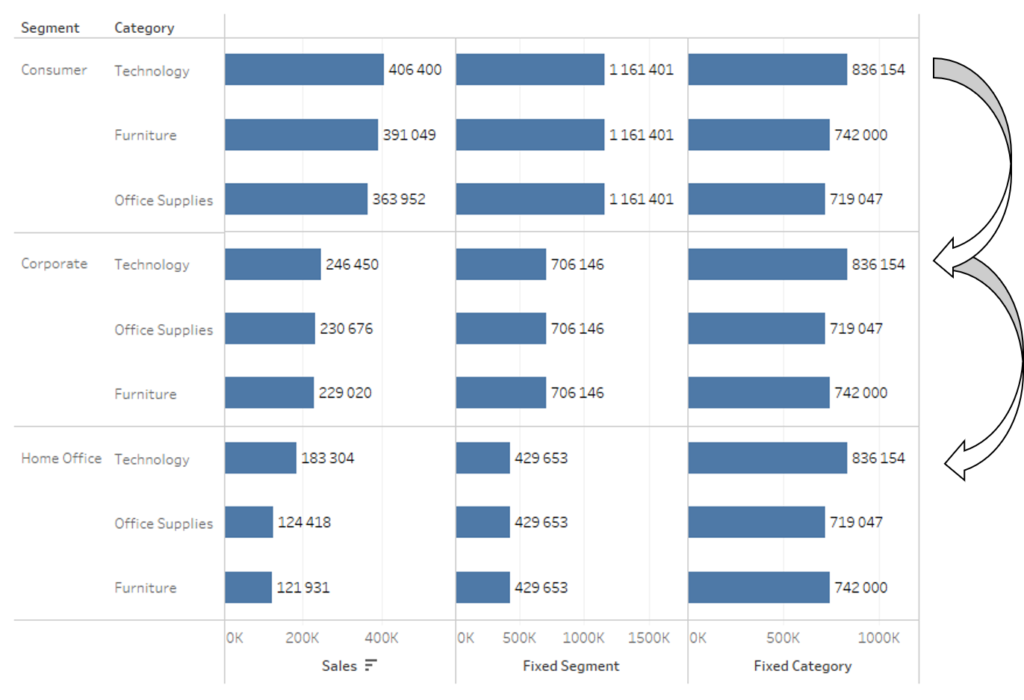
What is the difference between standard calculation and LOD? In the chart below, we see a comparison of total sales by segment and category and LOD with the Segment frozen dimension. As you can see, the calculation does not take into account the breakdown by category, and is only calculated at the Segment dimension level. Therefore, the value of this calculation is the same for each category.

To better illustrate this example, we add another measure, LOD FIXED at the Category level. As you can see for each category the values repeat in each segment.
FIXED LOD – put into practice
The question is what the FIXED LOD is used for. There are of course many applications, but I will focus on a few basic ones. First, the percentage of the total. With FIXED LOD, we can determine a measure at a given (higher) level of aggregation and then divide the measure at the lower level by that measure, yielding a percentage of the total:
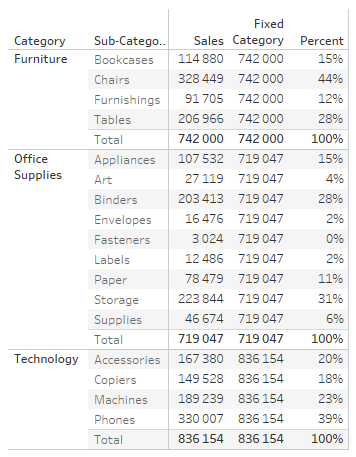
The desired effect can of course be obtained by using Table Calculations, but with TC we have to remember about proper parameterization of the function and its change when changing the layout of the visualization. In the case of LOD, we have a rigid calculation that we can apply at will.
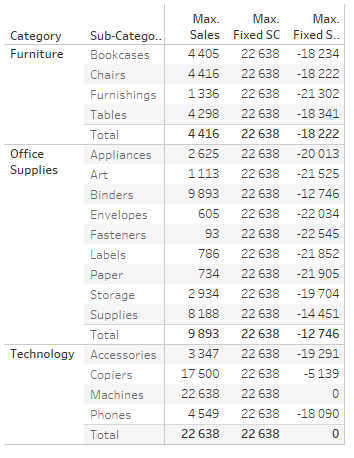
Another application is to look for the maximum value and then compare it to other values. Suppose we want to quickly find the maximum order – and for which category it occurs. Using the Calculated Field: {FIXED: max([Sales])} and then to determine the difference ([Sales])-{FIXED: max([Sales])} we immediately see that the largest order occurred for the Machines/Technology sub-category:
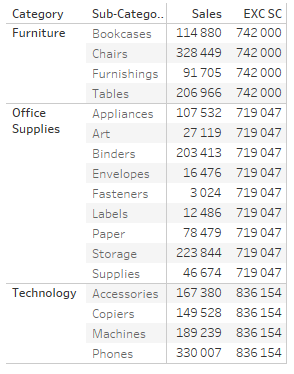
The last case would be to compare the value of sales to the value of the category. Suppose we want to compare the sales of all categories to the sales value in the Supplies/Office Supplies category. To do this, we determine the calculated field:
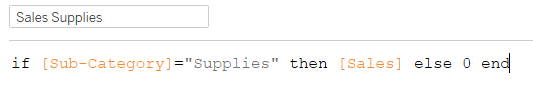
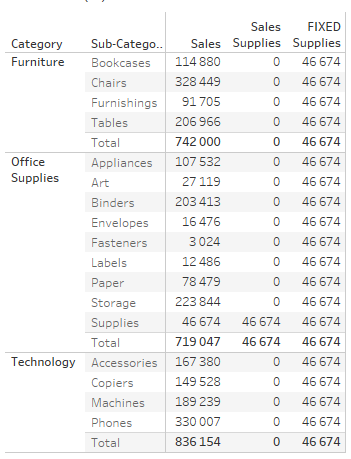
However, after adding the field to our table, the value according to the calculation will be determined only for the Supplies sub-category. To get around this problem, we will add a LOD calculation:
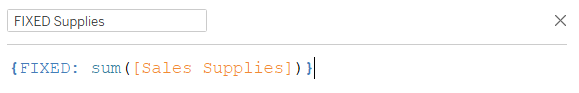
This is how we achieve the effect:
Not Just FIXED – LOD INCLUDE and EXCLUDE Calculations
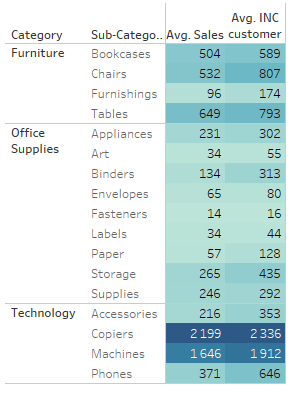
FIXED is one type of LOD, but not the only one. In addition to this option, we also have INCLUDE and EXCLUDE. Let’s start with INCLUDE. As the name suggests, this type of LOD adds dimensions to the calculation that we do not have in the visualization. Suppose we want to know the average sales by customer. If we put the Sales field in the Average aggregation in the visualization, then we get the average at the row (transaction/order) level. If you add LOD INCLUDE, then the customer name will be taken into account in the calculation:
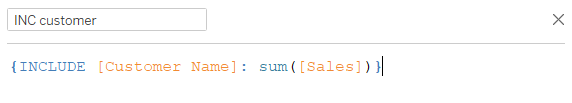
By aggregating the measure by average, we get average sales by customer – not by transaction as with the standard measure.
Since INCLUDE adds dimensions to the calculation, EXCLUDE works exactly the opposite – it eliminates dimensions from the calculation. If we want to determine sales by category in the case under analysis, we can use EXCLUDE LOD:

Producing a similar effect to the FIXED function:
LOD- FIXED, INCLUDE OR EXCLUDE calculations?
FIXED LOD is the most commonly used and most practical. With FIXED we can achieve exactly the same results as with INCLUDE and EXCLUDE. So in order not to mess with the syntax too much often purely practical analysts use mostly FIXED. Keep in mind one major difference, namely the different position of FIXED and INCLUDE/EXCLUDE calculations in Tableau’s calculation order (order of operations):
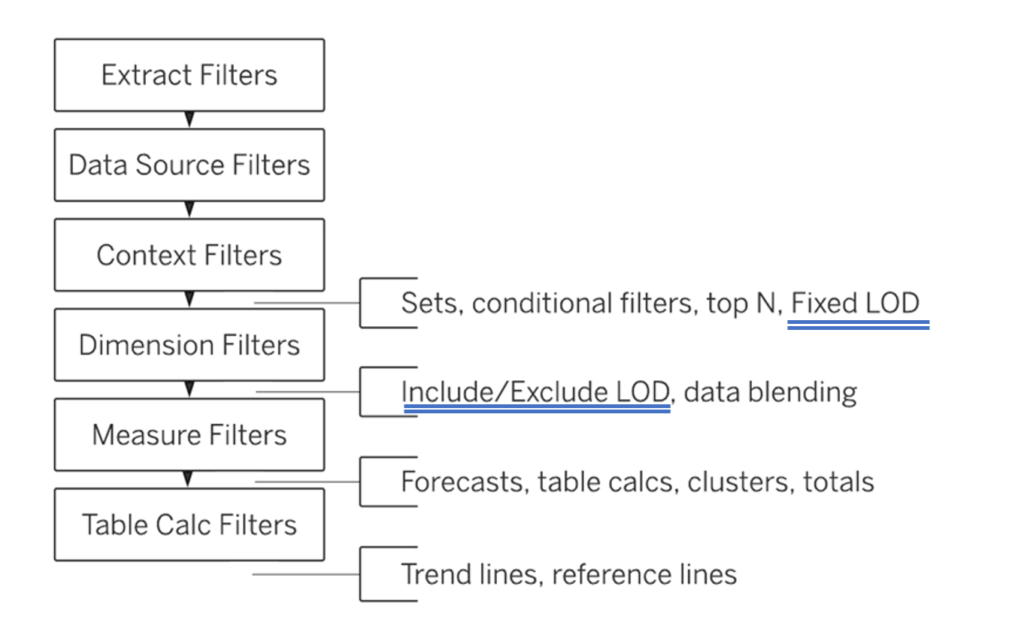
FIXED LOD is calculated before Dimensions and INCLUDE/EXCLUDE is calculated after. This affects how calculations are done, so keep this in mind and add filters to the context if necessary (i.e. move from Dimension to Context filters).
QUICK LOD – simple calculation creation
In one of the latest versions of Tableau (2021.1), an option was added to quickly create LOD calculations. To create a quick FIXED LOD simply select a measure, then with the control button on the keyboard pressed, move the measure to the selected dimension by which you want to aggregate the measure. A new calculated field containing the appropriate syntax will automatically be created:
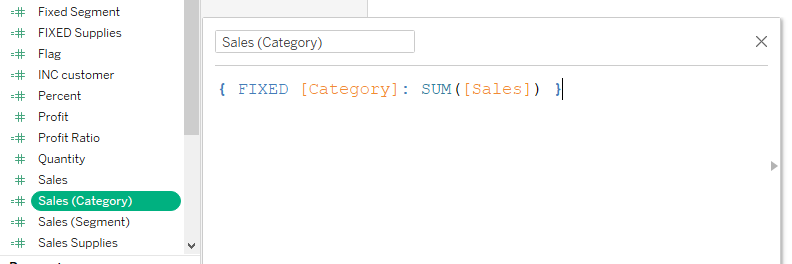
Unfortunately, apart from creating a field and syntax, the solution does not provide too many options – we still have to edit the more advanced case ourselves, adding new dimensions or changing aggregations. Nonetheless, it is a certain convenience especially for novice users.
Mateusz Karmalski, Tableau Author


