All companies have countless amounts of data which are detailed information that you use to improve your business. To discover the dependencies between the data and the resulting benefits, you need to know how to analyse it. Power BI is a Microsoft tool that allows you to visualize and analyze data simply and intuitively. Both these skills are a key element in creating interactive reports. What is the difference between Microsoft Power BI and other tools for visual data analysis? For whom is it designed and who are the recipients of the visual effects of this tool?
Microsoft Power BI – What businesses is it suitable for?
Power BI is suited both for small companies and large holdings. No matter the industry, it can support various departments such as production, sales, financial reporting, logistics, warehouses, marketing, hr, etc…
Connecting with various data sources.
Power BI allows you to import data from diverse sources and transform it into transparent reports that will provide detailed information for analysis. The interactivity of the reports enables to analyze them quicker and easier. This facilitates the decision-making process, which is key in every business. The tool allows you to import Excel and CSV files, as well as to connect the data derived from Microsoft Dynamics, Google Analytics, Marketeo or Salesforce. It can also be linked to cloud databases. By using appropriate queries, you can also make direct connections with such services as Azure SQL Database, Azure SQL Data Warehouse, Spark on Azure HDInsight and SQL Analysis Services. Power BI also allows you to connect directly to local databases of the SQL Server Analysis Services.
How to transform the data to prepare it for Power BI?
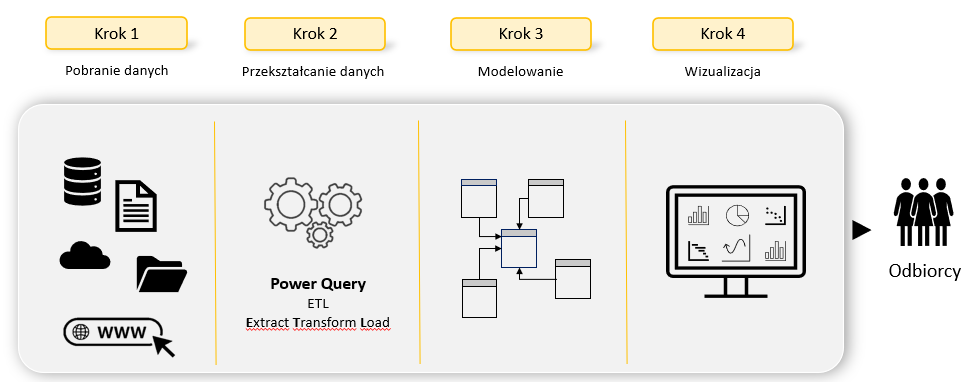
Power Query is a Microsoft tool which enables you to transform, import, or combine the data with data from other sources. You can then model the data to facilitate further analysis in Power BI. You may remove columns, change the types of data, merge tables, and then load a query into Power BI in order to create a chart or report… This functionality consists of four phases: Connect – Transform – Combine – Load. You connect data in the cloud, service or stored locally, then you model the data to your liking. You need to determine which data will be required for the analysis. It’s worthwhile to ask the users, for whom the report is intended, for their opinion and find out what data they would like to see in the final report. Remember that the essence of the report is the visual analysis that is addressed to a specific recipient. When modelling the data in accordance with your needs, you don’t interfere with the original source. If you wish to further transform the data based on that source, you may do that without losing any data. The next element is to integrate the data from various sources – in other words to merge the data to obtain a unique view. Then you need to load your data into a sheet or data model. Now your data is ready for further analysis in Power BI.
Why Microsoft Power BI?
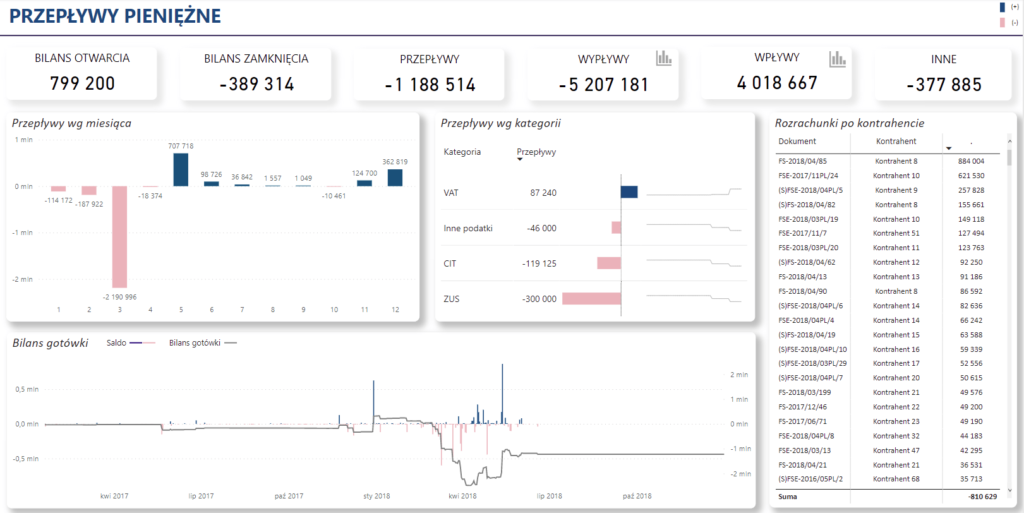
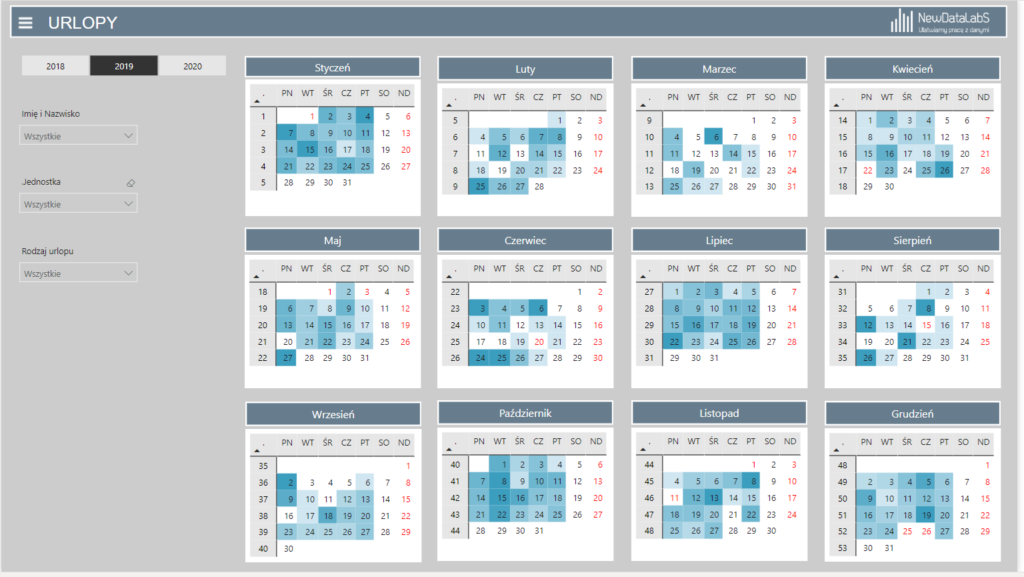
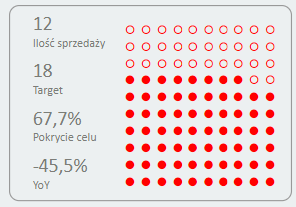
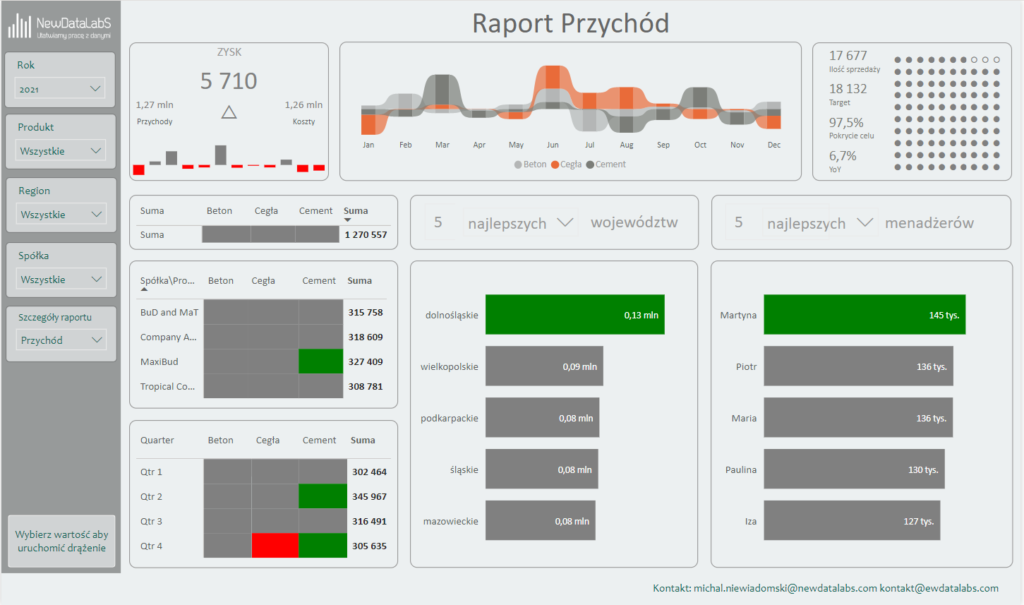
Power BI is a simple and intuitive tool intended for visual data analysis. It offers a wide spectrum of ready-to-use, standard visualizations that you can use to prepare your reports. All ready-to-use charts can be easily tailored to your requirements to help you create effective data presentations. In addition to the embedded charts, there are also charts shared by Power BI communities in the Marketplace. If you are an advanced user of DAX, you can transform basic visualizations into complex objects to present the key parameters (e.g. converting Matrices into Waffel Charts).
Those who work with Excel and know the DAX language for data analysis, will find it easy to work with Power BI and appreciate the advantages of this tool. The integration with Excel eliminates the need to export files, and the Power BI interface is similar to the one in Excel.
The tool also has search interfaces in the natural language – English, but also in Polish. It allows users to create visualizations and search for detailed information with the help of Polish phrases. This way you don’t need to know the code or programming language. When writing a query, the tool will automatically display a list of possible queries. In addition, it suggests an appropriate visualization of a table or chart that will best present the data. The Q&A model enables you to ask voice questions, for example through a mobile device. As a result, you will get visual suggestions of analyses for measures and their aspects.
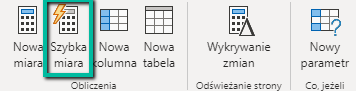
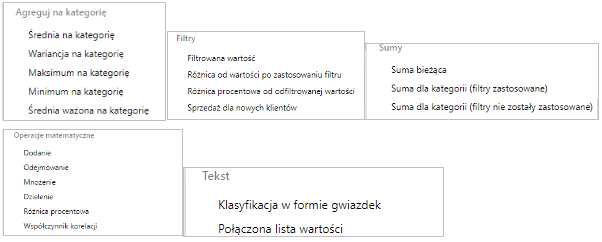
Power BI stands out in the Business Intelligence tools markets for its availability and barrier-free access. You don’t need to buy a license in order to download a fully functional Power BI desktop application and start working with the tool. You can build measures without programming knowledge, as the tool offers default measures that can be used to prepare the most common queries.
Power BI is a helpful solution both for analysts who start their journey with visual data, and for advanced users. Would you like to find out what you can gain from Power BI? Before you decide whether to implement this tool, the best approach would be to carry out a Proof of Concept analysis, which NewDataLabS can prepare for you. If you would like to find out more about other advantages of this solution, please contact us on https://newdatalabs.com/en/power-bi/.


