Dax is a basic language for building formulas in Power BI. The intelligent use of creating queries combined with the set of standard visualizations allows us to improve the quality of reports. The advantages of this solution are the simplicity of data analysis and the practical applications of visualizations.
The use and development of the competences related to creating Dax queries can be divided into several key categories. The below categories will help you systematize knowledge in this regard.
- Building tables
- Using measures
- Creating advanced visualizations
- Working with parameters
- Conditional formatting
DAX- building tables
Begin working on a report by preparing a good data model. For this reason, the first area touches on building tables using DAX formulas. The most common table allows you to prepare a calendar, and there are two methods to choose from. The first method uses the CALENDARAUTO function. It verifies all date columns and selects the minimum and maximum dates as the range of the calendar that is created. The second method allows you to determine the range by using the CALENDAR function. It enables you to specify the range of time to be taken into account. The best way is to provide at least a column with the year from the fact table, which will be used to create relationships and close the table by indicating the end of the next year. For example:
CALENDAR(
DATE(YEAR(MIN(Table[Column with date])),1,1),
DATE(YEAR(TODAY())+1,12,31)
)
The new calendar can be further developed by adding new columns using such functions as MONTH, YEAR, DAY, WEEKDAY, and WEEKNUM etc.
As shown in the above example, in the context of building one table using DAX, there are several ways to achieve the expected result. The flexibility of the formulas allows you to determine how specific your solution will be.
Other formulas that can be used to build tables such as tables with measures are GROUPBY, SUMARAIZECOLUMN and CALCULATETABLE. If you want to combine several tables using DAX, you can do that with such calculations as UNION, CROSSJOIN, NATURALINERJOIN, and NATURALLEFTOUTERJOIN.
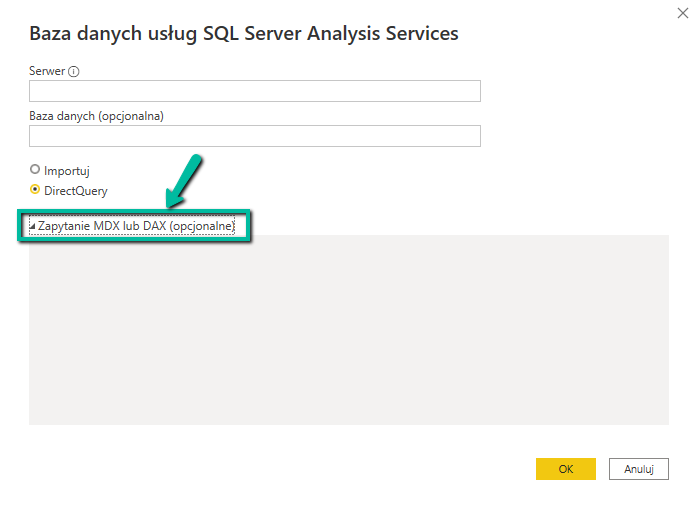
With respect to the last calculation group, a question may arise as to for what purposes you could use the functionality of creating queries in DAX, which should be prepared at the stage of building a data source or performing transformations in Power Query. The answer would be to explore further the areas in which DAX language could be used. A less known area, in addition to working with DAX directly in Power BI, is to use it at the stage of connecting certain data sources. There are types of data sources such as SQL Server Analysis Services, where instead of creating formulas using MDX, you can do that with the help of DAX.
A further way of using tabular functions is to treat them as temporary tables. They are calculated inside the measure, for example to count the TOPN of elements. Such use of tables in measures, in combination with filters, will allow you to prepare detailed and effective calculations, without creating additional tables and managing the relationships between them.
DAX- using measures
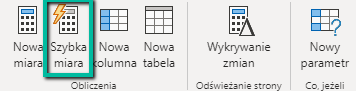
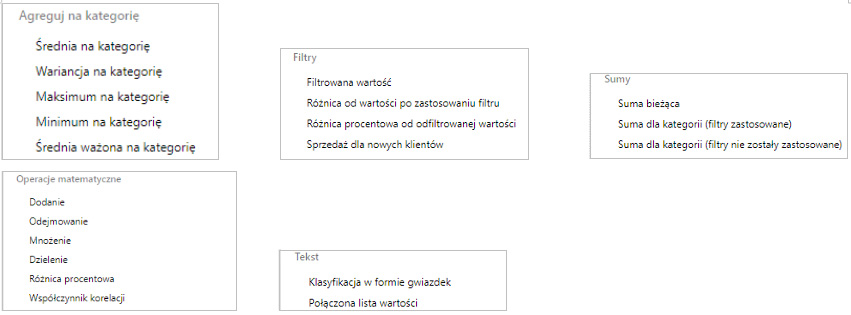
Another area where you could use DAX queries is to create measures. Power BI has prepared a set of default measures. They allow you to quickly prepare basic calculations, such as comparing YTD or YoY. The main advantage of quick measures is that they help users unfamiliar with this tool to build calculations through graphical interface without knowing DAX.
After getting to know quick measures, you usually develop a thirst for knowledge and want to further explore them – it’s worthwhile to complete a training course on the subject. It is useful to be able to separate the most important formulas from the list of dozens available calculations. The most essential functions are those which allow us to change the context of the filters.
Creating advanced visualizations
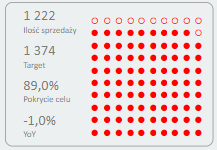
Combing the measures and tables prepared in DAX allows you to take the reports to a higher level where you can further develop standard visualizations. It is worth to mention such functions as altering a matrix to create a Waffle Chart.
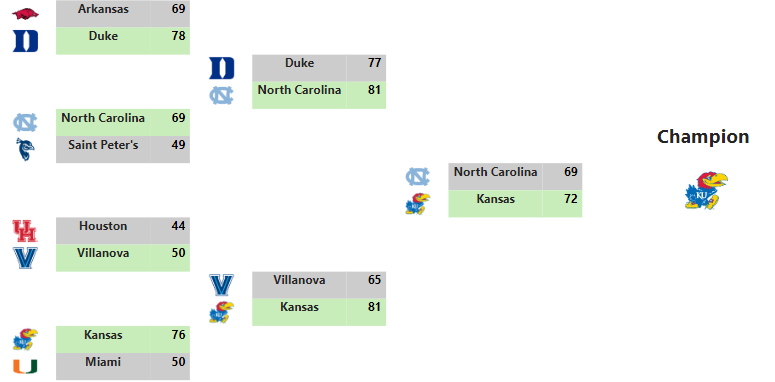
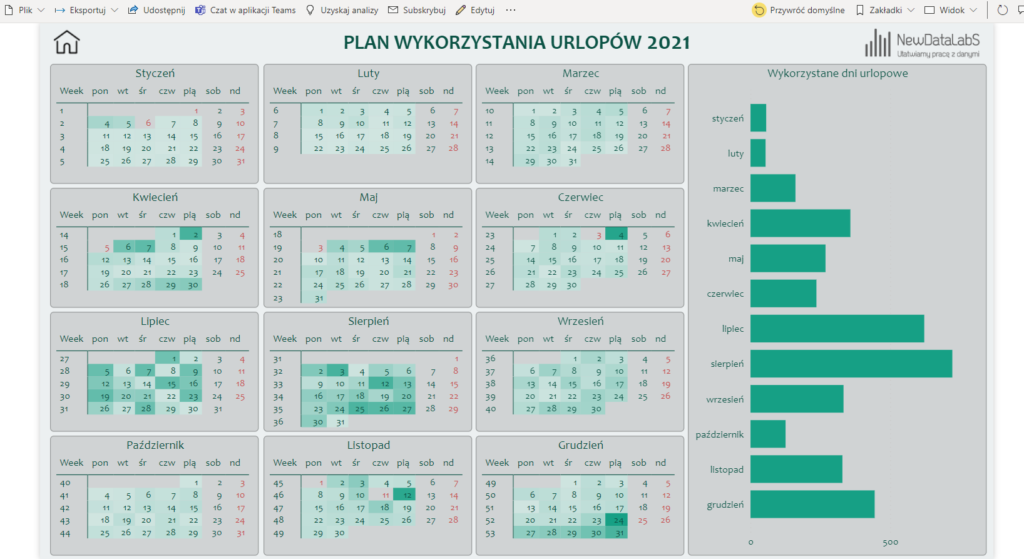
Matrix, as a default visualization in Power BI, is a helpful object. It allows you to create ladders shaped to resemble sports competitions, or calendars presenting the level of the annual leaves taken.
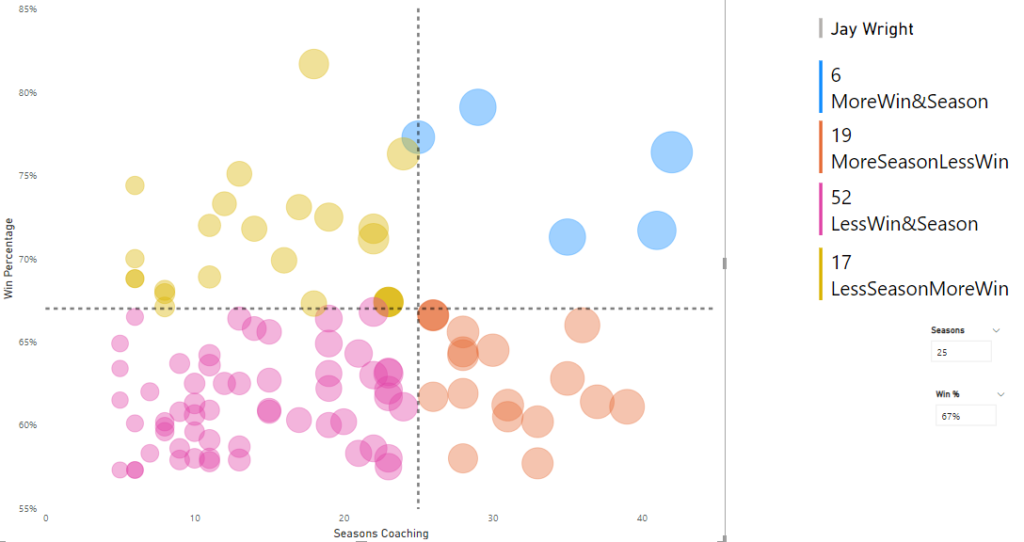
Another type of visualization which can be separated is the BCG Matrix that can be built by means of dynamic management of the axes in point charts.
Creating parameters, altering default DAX formulas
When working with Power BI, a good practice is to use parameters. Until recently, only one type of parameter was available – the value parameter. This solution allowed us to primarily create such analyses as What IF. The greatest advantage of this parameter is that the end user can enter specified assumptions in the report. It now has as new parameter – “field” – a text parameter that refers to the measures and dimensions used in the report.
Parameters are automatically added, and if you are familiar with the DAX queries, you will be able to alter them once they are created.
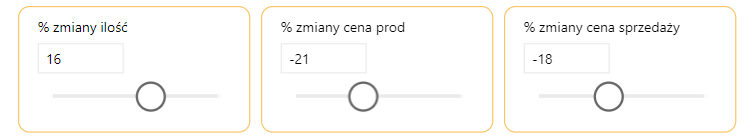
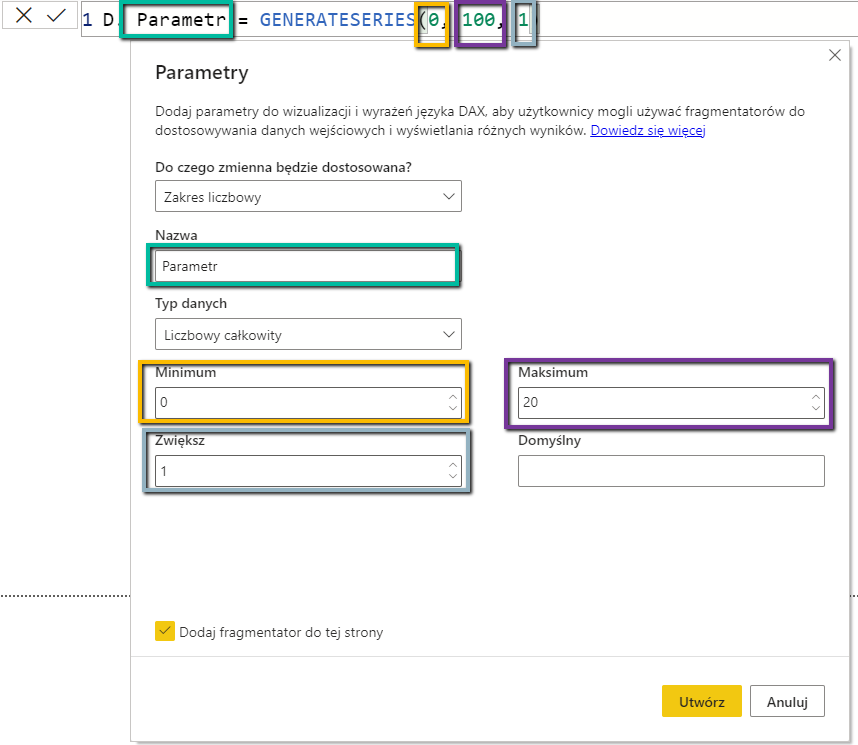
In the case of the value parameter, by modifying the GENERATESERIES you can change the properties set up at the stage of creating the parameter, such as the range of values and the minimum range. The below screen shows the creation of a parameter and the formula which reflects the underlying tables. I marked the maximum value with violet, and I adjusted it manually after adding the parameter. This allowed me to increase the maximum possibility to enter the value into the parameter field.
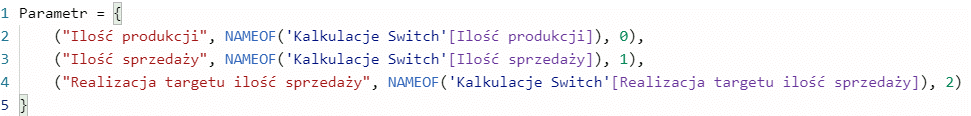
The new option in Power BI – the text parameter – also uses the DAX formula that can be edited at a later stage. The possibility to enter changes allows you to modify the names, but most of all, you can add new fields by coping the last line and replacing the name of the field and the related measure. The last step is to determine the order of the measure in the created list.
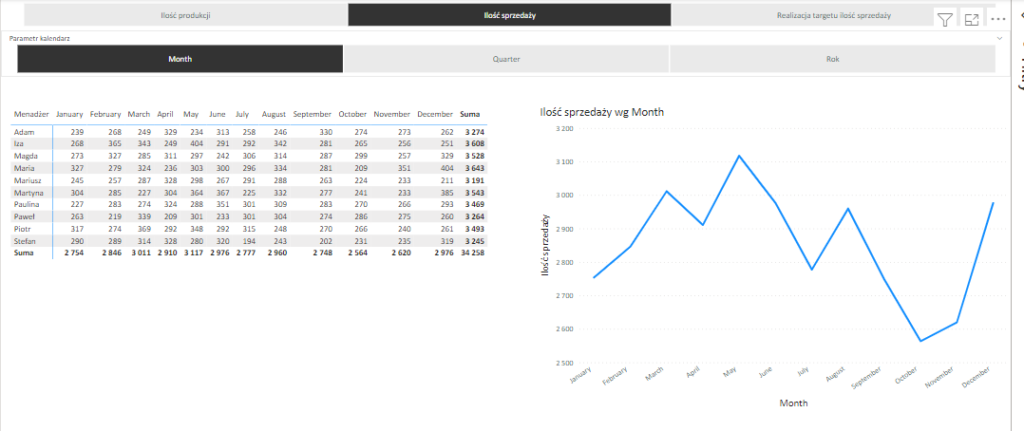
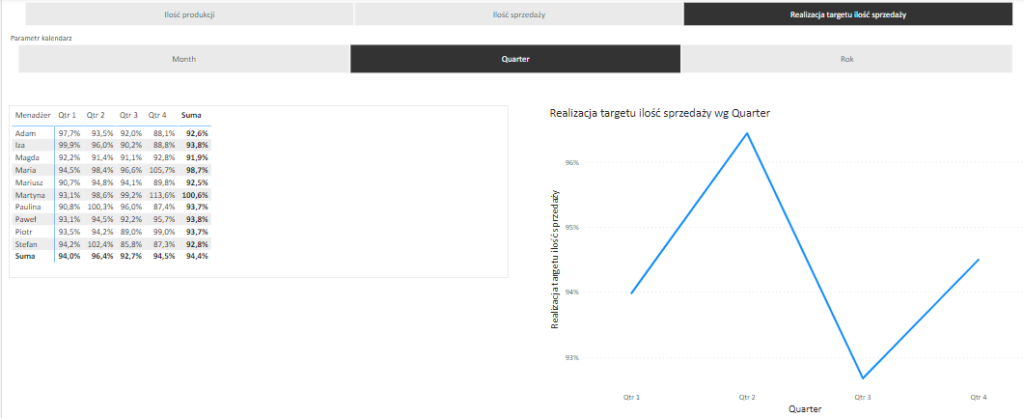
The below example demonstrates the practical use of the two text parameters combined. Firstly, you can see the sales volume in a monthly format. Next, with the use of parameter, the table and the chart were switched to the measure Target Performance of the sales volume in a quarterly format. Formatting is a helpful function when working with field parameters. It was not possible to use it in the previous solution, which was based on the SWITCH function, for example in the case of line charts.
Conditional formatting using DAX
When writing about DAX, it’s important to mention about the possibility to manage colors and icons from the level of formulas. It is possible to create a condition in the formula to change the colors by writing the name of the color in English. Another way to do this is to indicate the RGB code of any color corresponding to the color palette used in the report.
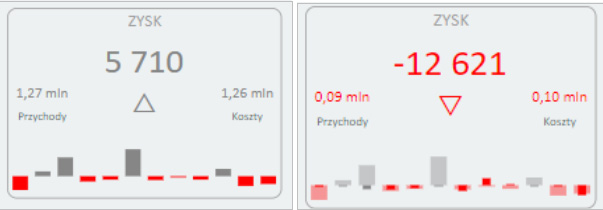
Another functionality related to the formatting is the ability to change the icon placed, for example, under the KPI, by using the UNICHAR function. This solution enables you to use any icon, out of hundreds of pre-defined icons with numerical values assigned that you enter when creating a formula.
Summary
In the above post we have distinguished the key areas relating to the use of formulas prepared in DAX. There is a wide range of feasible options and often your imagination is your only limitation. The main advantage is the flexibility of formulas and the set of measures. They are designed in a way to allow inexperienced users of visualizations to prepare basic calculations and create functional reports, even without knowing how to use DAX. In my next posts I will present in more detail separate calculation groups.
Michał Niewiadomski Power BI Team Manager


