Tableau
– intelligent analytics for your company
Transform the way decisions are made in your company. Combine speed with precision using Tableau. Gain actionable real-time insights and analyses that enable rapid, data-driven decisions. Save time and money while maximising your team’s efficiency.
Contact us
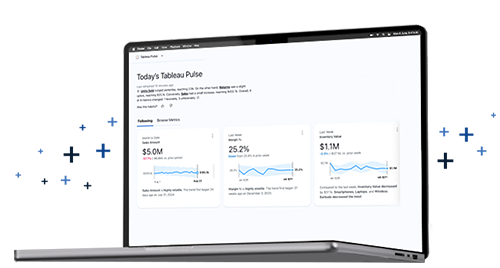
Tableau: a new way of working
with data for every employee in your organisation
In every organisation, each employee — from Top Management to specialists — tracks different metrics that are critical to their daily responsibilities.
 Marketing Director monitors lead volumes; the Head of Production oversees completion rates of orders, quality levels, and the workload of machines and staff.
 Logistics Director checks delivery timeliness and completeness,
 Purchasing Manager verifies the discounts negotiated by their team.
 Accountant will be interested in payment timeliness and the number of posted documents,
 Security Manager monitors the number of incoming and outgoing external visitors.
There are many data sources for these metrics in every company, and only some are integrated; data refresh at different intervals. During our projects we can integrate all of these data sources and — thanks to Tableau — provide users with immediate access via a mobile app, messaging platforms (Slack, Teams) or email. Additionally, AI mechanisms can interpret changing data and explain the reasons behind fluctuations.
There are many data sources for these metrics in every company, and only some are integrated; data refresh at different intervals. During our projects we can integrate all of these data sources and — thanks to Tableau — provide users with immediate access via a mobile app, messaging platforms (Slack, Teams) or email. Additionally, AI mechanisms can interpret changing data and explain the reasons behind fluctuations.
Schedule a Tableau presentation
Contact usTableau – what it is

Intuitive interface
Tableau is an intuitive tool that enables rapid report and visualization creation without the need for programming. With a simple interface you can ask a question and immediately receive a clear analysis — even without specialised technical knowledge.

Speed
Use Tableau to analyse data and access it hundreds of times faster than with traditional tools. Make business decisions based on data to save time and reduce costs.

AI in Tableau
Leverage modern AI in Tableau to automatically identify trends, analyse deviations and highlight significant changes. Enable effective management and rapidly adapt strategy.

Data sources
Tableau is a BI tool based on the Data Discovery approach, enabling visual analysis from over 100 sources — from Excel and SQL to Google Analytics or Hadoop. With ready connectors and an intuitive interface, anyone can perform analysis, not just specialists. Tableau integrates with other BI platforms to provide a comprehensive business view based on diverse data.

Access to data
Tableau provides mobility and integration with platforms such as Slack and Teams, allowing continuous monitoring of metrics and rapid response to changes. With full control over your data you gain greater efficiency, time savings and improved results.

Security
Tableau provides advanced data protection through encryption, access controls, row-level security and integration with single sign-on systems. These features ensure that confidential information remains secure even during query transmission.

Data privacy
All Tableau solutions are cloud-based, allowing secure and efficient storage and processing of large datasets. Your data is carefully protected and its privacy is our priority. Tableau operates under the principle “your data is not our product” — your data remains fully under your control.

Data quality
A key element of Tableau’s effectiveness is having high-quality data — consistent, complete and up-to-date. Such data is the foundation for advanced AI that analyses information and delivers recommendations on critical business areas. Combine data from across departments to make fast, well-informed decisions.

Real-time KPIs
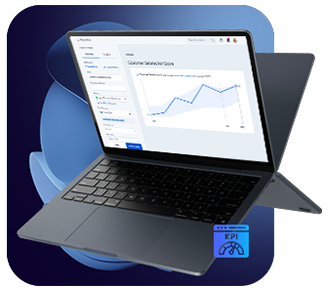
Acquire a tool that delivers personalised, contextual insights about key performance indicators (KPIs) in real time. Monitor results continuously and optimise operations.
Download a free Tableau DEMO
Download Tableau TrialTableau – products


Tableau Desktop
One of the Tableau products is Tableau Desktop, which enables connecting to data and analysing it in just a few clicks. Use Tableau Desktop to create visualisations and dashboards without coding. Share analysis results quickly and easily. Its in-memory database engine accelerates analysis and allows users to filter and drill into data. The result is an interactive, clear visualisation that helps you understand your data.
Learn more >
Learn more >


Tableau Server
Tableau solutions also include Tableau Server, which enables analysis not only in a browser but also on mobile devices. It provides permission management and data security for dashboards published on the Tableau server. After publication, users can filter, highlight and analyse server content. By integrating the tool with the company’s database architecture, organisational security protocols are respected and compliance requirements are met even for the largest organisations.
Learn more >
Learn more >


Tableau Prep
This tool is designed to prepare data for analysis in Tableau. Use Tableau Prep to clean data and create arbitrarily complex data sources. Tableau Prep helps you verify data quality and understand data structure. You can trial Tableau products for free. NewDataLabS offers a complimentary 14-day access to explore their features. Take the opportunity to visualise your data and drive your company’s success.
Learn more >
Learn more >


Tableau Cloud
Tableau Online is the cloud-based web platform. Use it to share views, dashboards and data sources without IT support or local servers. Publish dashboards, filter and drill into data, edit reports on the site and save changes. Receive subscriptions and refresh data. The platform is hosted by Tableau and data access is restricted to authenticated users only.
Learn more >
Learn more >


Tableau Pulse
Tableau Pulse enables automatic monitoring of key business indicators and immediate alerts for anomalies, allowing faster response to changes. It integrates with everyday work tools (e.g. Slack, Teams), delivering contextual, real-time data. This supports data-driven decisions without constantly reviewing dashboards.
Tableau – why implement it?

What benefits does implementing Tableau bring? The tool enables lightning-fast data analysis and can process hundreds of millions of records in a very short time. Working with Tableau is faster, smoother and more efficient. Creating analyses and dashboards and sharing them takes just moments. With clear visualisations, Tableau helps you understand data and facilitates making the right business decisions.

 Read more
Contact us

 Read more
You can use the tool not only on a computer but also on mobile devices, which facilitates access to analysis results. Tableau creates unlimited possibilities for data analysis. In a single extract you can combine data from various sources. You can also present data on point or area maps. The tool is accessible to everyone and does not require IT knowledge to operate.
Contact us


