In the previous posts, we explored the basics of data processing in Tableau Prep. We started with loading the data, then we cleaned it and applied various transformation options: grouping, splitting or filtering. We also learned how to create calculation fields. In this last post of a series, we will present additional methods of data transformation: aggregation, pivoting and blending. Lastly, we will discuss exporting data for further visual analysis in Tableau Desktop. We will also highlight what else is possible using Prep as a tool for the daily work of analysts.
Data Aggregation
In a situation where your data is shown in more detail than you need it, you can aggregate it in Prep. For example, when you have the purchase order data broken down into individual items (products), you can aggregate them at the purchase order level, to allow their analysis at a later stage. To aggregate data in Prep, use the Aggregate (1) feature. In the editor, select the grouped fields to be used in aggregation (2), and the aggregated fields, which are the measures to be aggregated (3). In this example, we will aggregate the average price by vehicle brands:
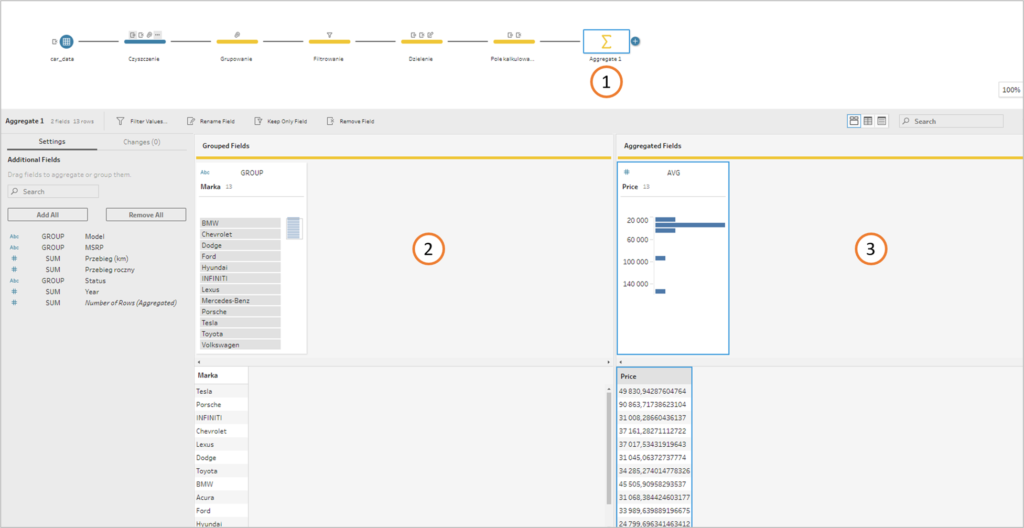
Next, add Clean to view your data. You will get a tailored dataset that contains Macros and Price fields only.
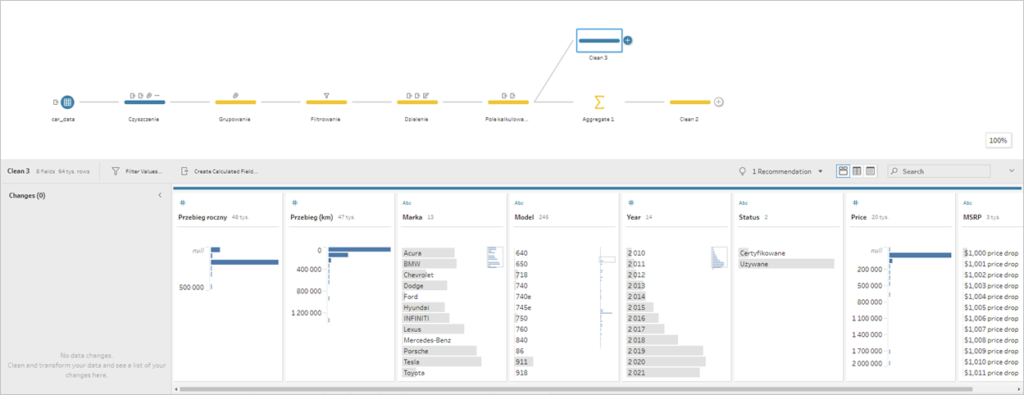
Let’s stop for a moment here. Prep enables not only a linear data flow – we can create parallel flows, generating various transformation options of one dataset. We will do that in our scenario by adding another field before moving on to Aggregate. This will allow to display the detailed data at the top, and the aggregated data at the bottom of the flow.
Data pivoting
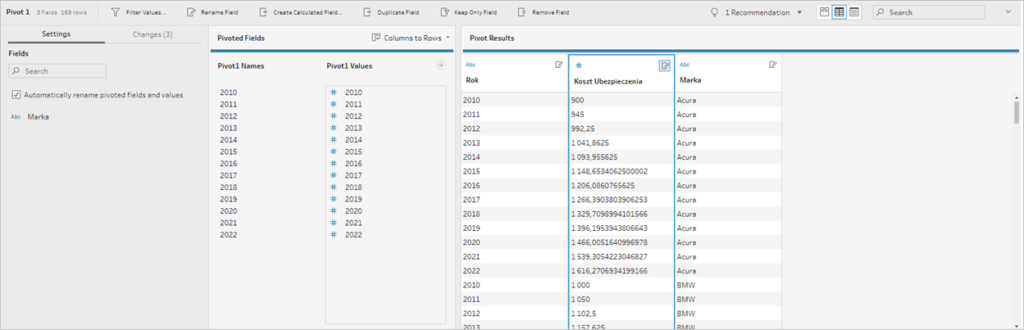
It is often the case that analysts need to work with the data, which is not in a database format, but in a tabular form. Particularly in finance, where rows represent measures, and columns represent values for various periods. To perform a meaningful analysis of the data structured in this way, you need to pivot the data, in other words, to rearrange it. Prep has a separate Pivot function to help you do that. Let’s assume that you want to include premium rates in the data arranged in a tabular format – rows represent car brands and columns refer to the car’s age:
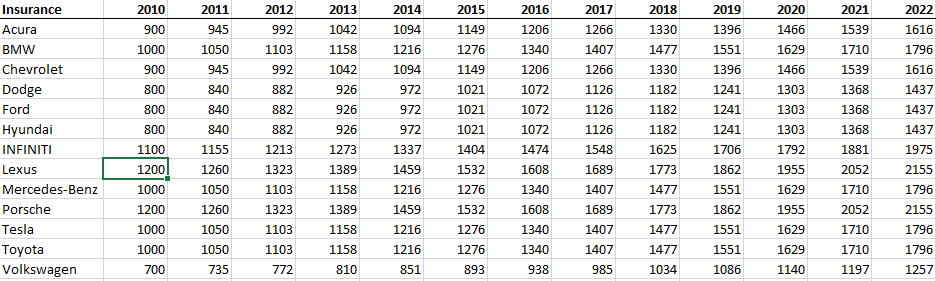
Load the data into Prep. In the first step, you will see your data in the same format as in Excel:
Add another step: Pivot. In the editor, add your columns with the values as Pivoted Fields. They will be transformed into fields with headers in a separate column. Next, change the name of the newly created columns to Year and Cost, and the Insurance field to Brand. This way you will get an appealing database format of the original table for further analysis:
Connecting data from many sources
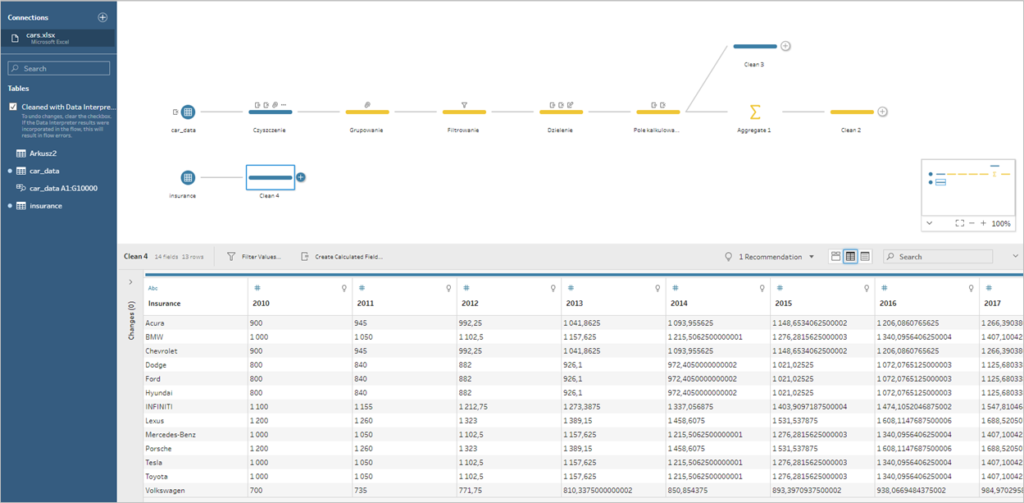
One of the basic operations in Excel that is an essential tool for analysts, is the VLOOKUP functionality. It is a very useful function, but it requires high computing performance, especially when working with large databases. Despite this, it allows us to display in our dataset the information from various dictionaries. You can do that in Prep by connecting the data in the Join feature. We will use this functionality to add premium costs to our database. Start by adding a new step – Join which needs two inputs. We are going to use the database of cars and the cost table (1):
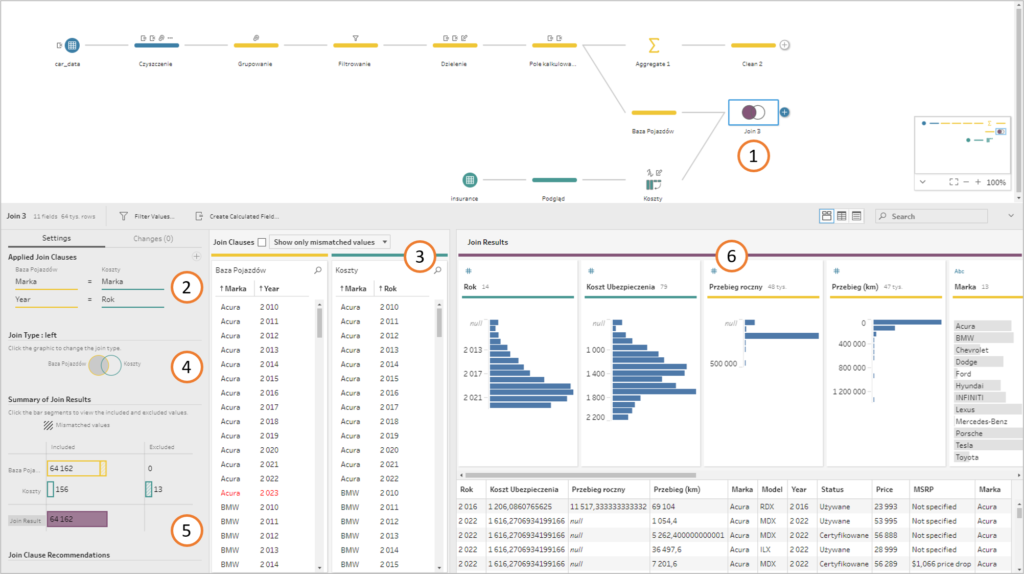
The next step is to define Join Clauses in order to determine which fields should be connected. You can see the data in a preview (3). It is worth noting the colours, which are consistent with the colours used in the flow to make it easier to understand what they represent. Next, you need to arrange your Join by selecting one of the following options:
1 – Left – it’s the most useful; you add to the source on the left side the information from the source on the right. If any attribution is missing, it will appear in the box (5)
2 – Right – just like for the left: you add to the source on the right the information from the source on the left
3 – Full – the result will contain all items from the sources on the left and on the right
4 – Inner – the common part will be returned, and Not Inner – everything except for the common part will be returned
5 – Left/right only – the result has an item from one source, which is not included in the other source
In practice, we usually use the left/right joins. It is worth mentioning that you can also choose the type of Join by graphical interface – simply select the parts that you want to include. The result of the connected data can be viewed in a window (6), and it’s consistent with the colour design in the flow. Union is another method to connect the data – it allows you to join the data which has the same layout, by adding it to one another. In this example, you can add the sales data from a different region or a different brand. First, you need to add a separate source and in the next step – Union – connect it to the original table. Here you can pin into the flow at an early stage to avoid repeating transformation (1).
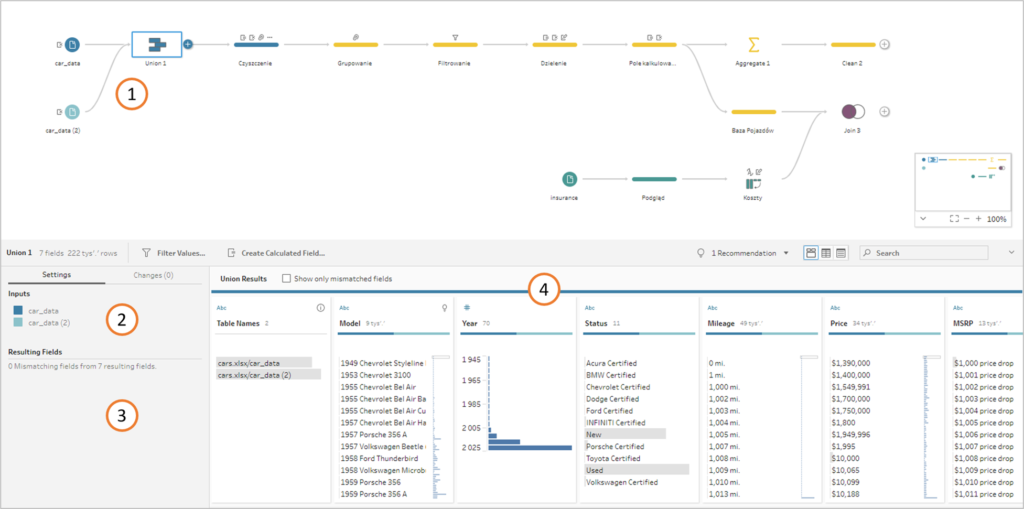
Component tables are listed in the panel (2), and any unmatched fields (that are missing in any table will also be shown in the panel (3). You will see the result of the Union in a window (4), where you can also see a new window that was automatically created by Prep – Table Names – which shows the source of your data.
Last update – data export
The last step of the data transformation in Prep involves exporting the data for further analysis. You can do that in Output, where you need to choose the Output type (file, published data source, database or CRM). The simplest way is to select the File for which you will specify the Location, the type of file (extract Tableau, Excel or text file), and how the data is going to be refreshed (create a table or Append – add the data to the existing table).
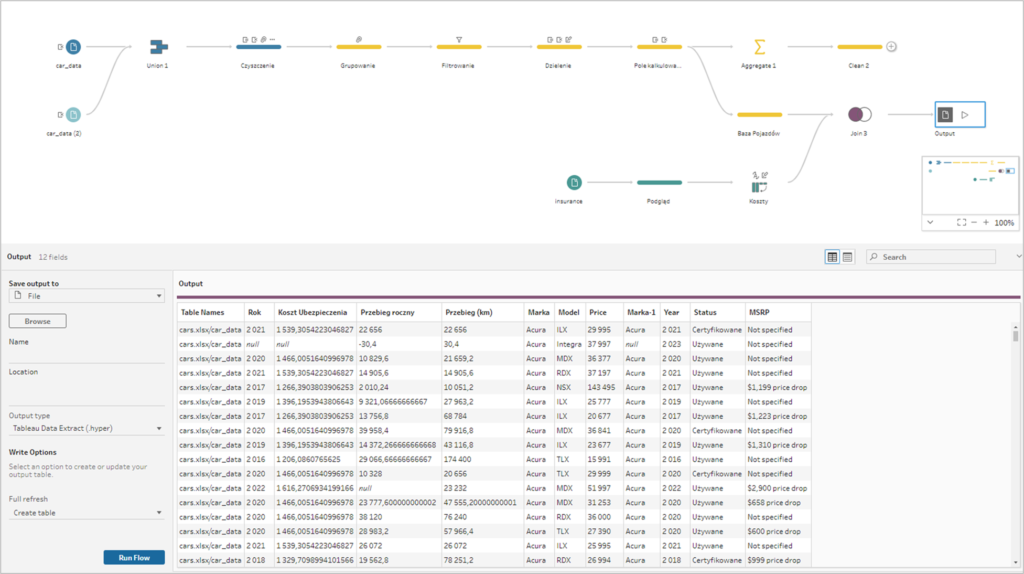
The last thing to do is to click the Run Flow in order to generate the Output, which can be used, for example, for visual analysis. If everything went fine and Prep didn’t detect any errors in the data flow, you will get the following message:
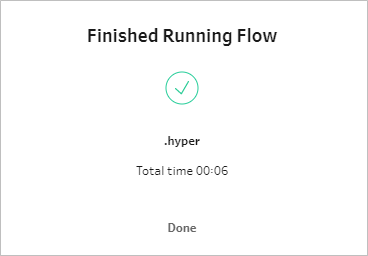
Tableau Prep tool for data analyst
Prep is a very efficient and visually attractive ETL programme. Despite this, it isn’t overloaded with options, and the graphical interface helps understand what is happening with your data at each stage of the transformation. Prep is a great tool particularly in terms of further analysis in Tableau Desktop, as it allows us to immediately extract the data in a hyperformat. This will simplify working with data in Tableau Desktop and make it more user-friendly.
Mateusz Karmalski, Tableau Author


