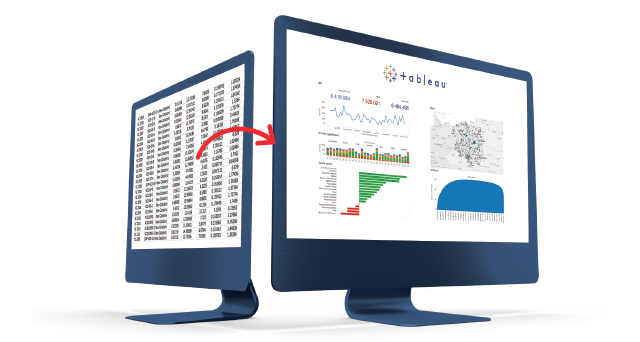
Business Intelligence
The need to process large amounts of business data is a significant challenge for many companies.
It turns out that traditional analytical tools are not enough to cope with the volume of information generated every day.
The solution is Business Intelligence tools that facilitate data management and making accurate business decisions based on it.
Find out more >

Which Business Intelligence tool to choose?
Tableau is the best BI tool, which we have tested in 200 projects. If you cannot choose Tableau then we suggest you other leading technologies like Power Bl, Google Data Studio.Select: Find out more >
Business Intelligence Tools

Tableau
Tableau has been considered the leading BI tool company for many years. According to our experts, it is the most flexible, efficient tool on the market. It is also a very powerful and scalable tool. A simple licensing model with no hidden costs should also be emphasized.
Creating analyses and visualizations in Tableau is incredibly easy. Tableau is a complete and independent BI platform that supports the entire process of creating and working with analytics – from preparing ETL data (Tableau prep) through building analytics (Tableau Desktop), to distributing and sharing them with end users and monitoring their work (Tableau Server).
Find out more >

Power BI
Popular Business Intelligence solutions include Power BI, which is part of the Microsoft platform ecosystem. Excel users will find it easy to use, although functionally and performance-wise it’s a less powerful tool than Tableau. Similarly, Tableau like Power BI allow you to connect to multiple data sources. However, the number of connections is less and the data transformation is handled by the Power Query tool.
Due to Microsoft’s licensing and product policies, the decision to start working with Power BI in-house actually means moving to the “cloud” with Microsoft. Despite its functional limitations, Power BI may prove to be a sufficient tool for users with smaller analytical and information needs, with not very large data volumes who are already using Microsoft cloud technology to a greater extent (Azure). Power Bi is developing dynamically and its users can count on frequent updates, which is both an advantage and a disadvantage of the tool.
Find out more >

Google Data Studio
To create an interactive report based on data from various Google tools, it’s a good idea to use Google Data Studio. This solution also allows its users to create connections to databases and use those built by the community.
The reports created in Google Data Studio are dynamic in nature. To refresh them, just click. The BI tool is easy to use, and Google Data Studio users have a wide selection of easy-to-read charts at their disposal.
Find out more >
Business Intelligence tools enable
– advanced data mining,
– conducting in-depth analyses,
– presentation of results in the form of clear, interactive visualizations,
– combining data from different sources,
– handling BI tools, usually without IT support,
– exchanging information and working on the same and verified, current and reliable data.
Find out more >

 you need the best BI tool,


